Introduction to Comet.ml
Comet.ml is an API-driven framework for workflow management in Machine learning and Data Science experiments. Comet’s hyperparameter optimization is roughly based on the Advisor hyperparameter black box optimization tool. It allows you to add API calls from your code to perform optimization on a selected set of hyperparameters using Comet’s cloud service. This requires that you install the comet python package ‘comet_ml’. The API is available for a variety of Machine Learning and Deep Learning libraries such as Keras, Tensorflow, Pytorch, Scikit-learn, Caffe etc.

Configuration for hyperparameter search
It allows you to select one of three strategies for hyperparameter search: Grid search, Random search and Bayesian search (SMAC). A ‘config’ object is created that declares the specification for this hyperparameter optimization. You can declare the hyperparameters you want to optimize over by specifying a type and constraints for the parameter search. The ‘scalingType’ key within ‘parameters’ dictates how samples are picked from the search space, it can be one of ‘linear’, ‘uniform’, ‘normal’, ‘loguniform’, ‘lognormal’. This will be followed by a spec key that tells the optimizer what metric or objective function to use for the optimization, the default is set to ‘loss’ which will have an objective of ‘minimize’. More information on the parameters to ‘config’ can be found here.
# We only need to specify the algorithm and hyperparameters to use:
config = {
    # We pick the Bayes algorithm:
    "algorithm": "bayes",

    # Declare your hyperparameters in the Vizier-inspired format:
    "parameters": {
        "HIDDEN_DIM": {"type": "integer", "min": 8, "max": 128},
        "DROPOUT": {"type": "float", "min": 0.0, "max": 1.0},
        "LINEAR_DIM": {"type": "integer", "scalingType": "Linear" , "min": 8, "max": 64}
    },

    # Declare what we will be optimizing, and how:
    "spec": {
      "metric": "test_acc",
      "objective": "maximize",
      "seed": 1
    },
}
Set up an optimizer as shown below and pass the ‘config’ object created above. A ‘project_name’ parameter helps to identify the project in the Comet.ml cloud workspace.
opt = Optimizer(config, project_name="optimizer-search-02")
Modifying the code
The code to perform the training of the network should be wrapped in a function that takes as arguments the hyperparameters that need to be optimized as shown below.
def func(HIDDEN_DIM_IN, DROPOUT_IN, LINEAR_DIM_IN):

    ...
    ...
    ...

    hyperparameters = {'HIDDEN_DIM': HIDDEN_DIM_IN, 'DROPOUT': DROPOUT_IN, "LINEAR_DIM": LINEAR_DIM_IN}
    test_loss, test_acc = train_new_model(hyperparameters, GET_NEW_DATA=False)
    return(test_loss, test_acc)
The optimization happens within a loop as shown below. At each iteration of the hyperparameter optimization run (trial), you can choose to log the metrics using the ‘log_metric’ method attached to each run.
for experiment in opt.get_experiments():
    experiment.add_tag("smaller_model_three_hyperparameters_opt")
    # Call the function that wraps the Neural Network code to start the experiment
    loss, acc = func(experiment.get_parameter("HIDDEN_DIM"),
                     experiment.get_parameter("DROPOUT"),
                     experiment.get_parameter("LINEAR_DIM"))
    experiment.log_metric("test_loss", loss)
    experiment.log_metric("test_acc", acc)
Comet.ml interface
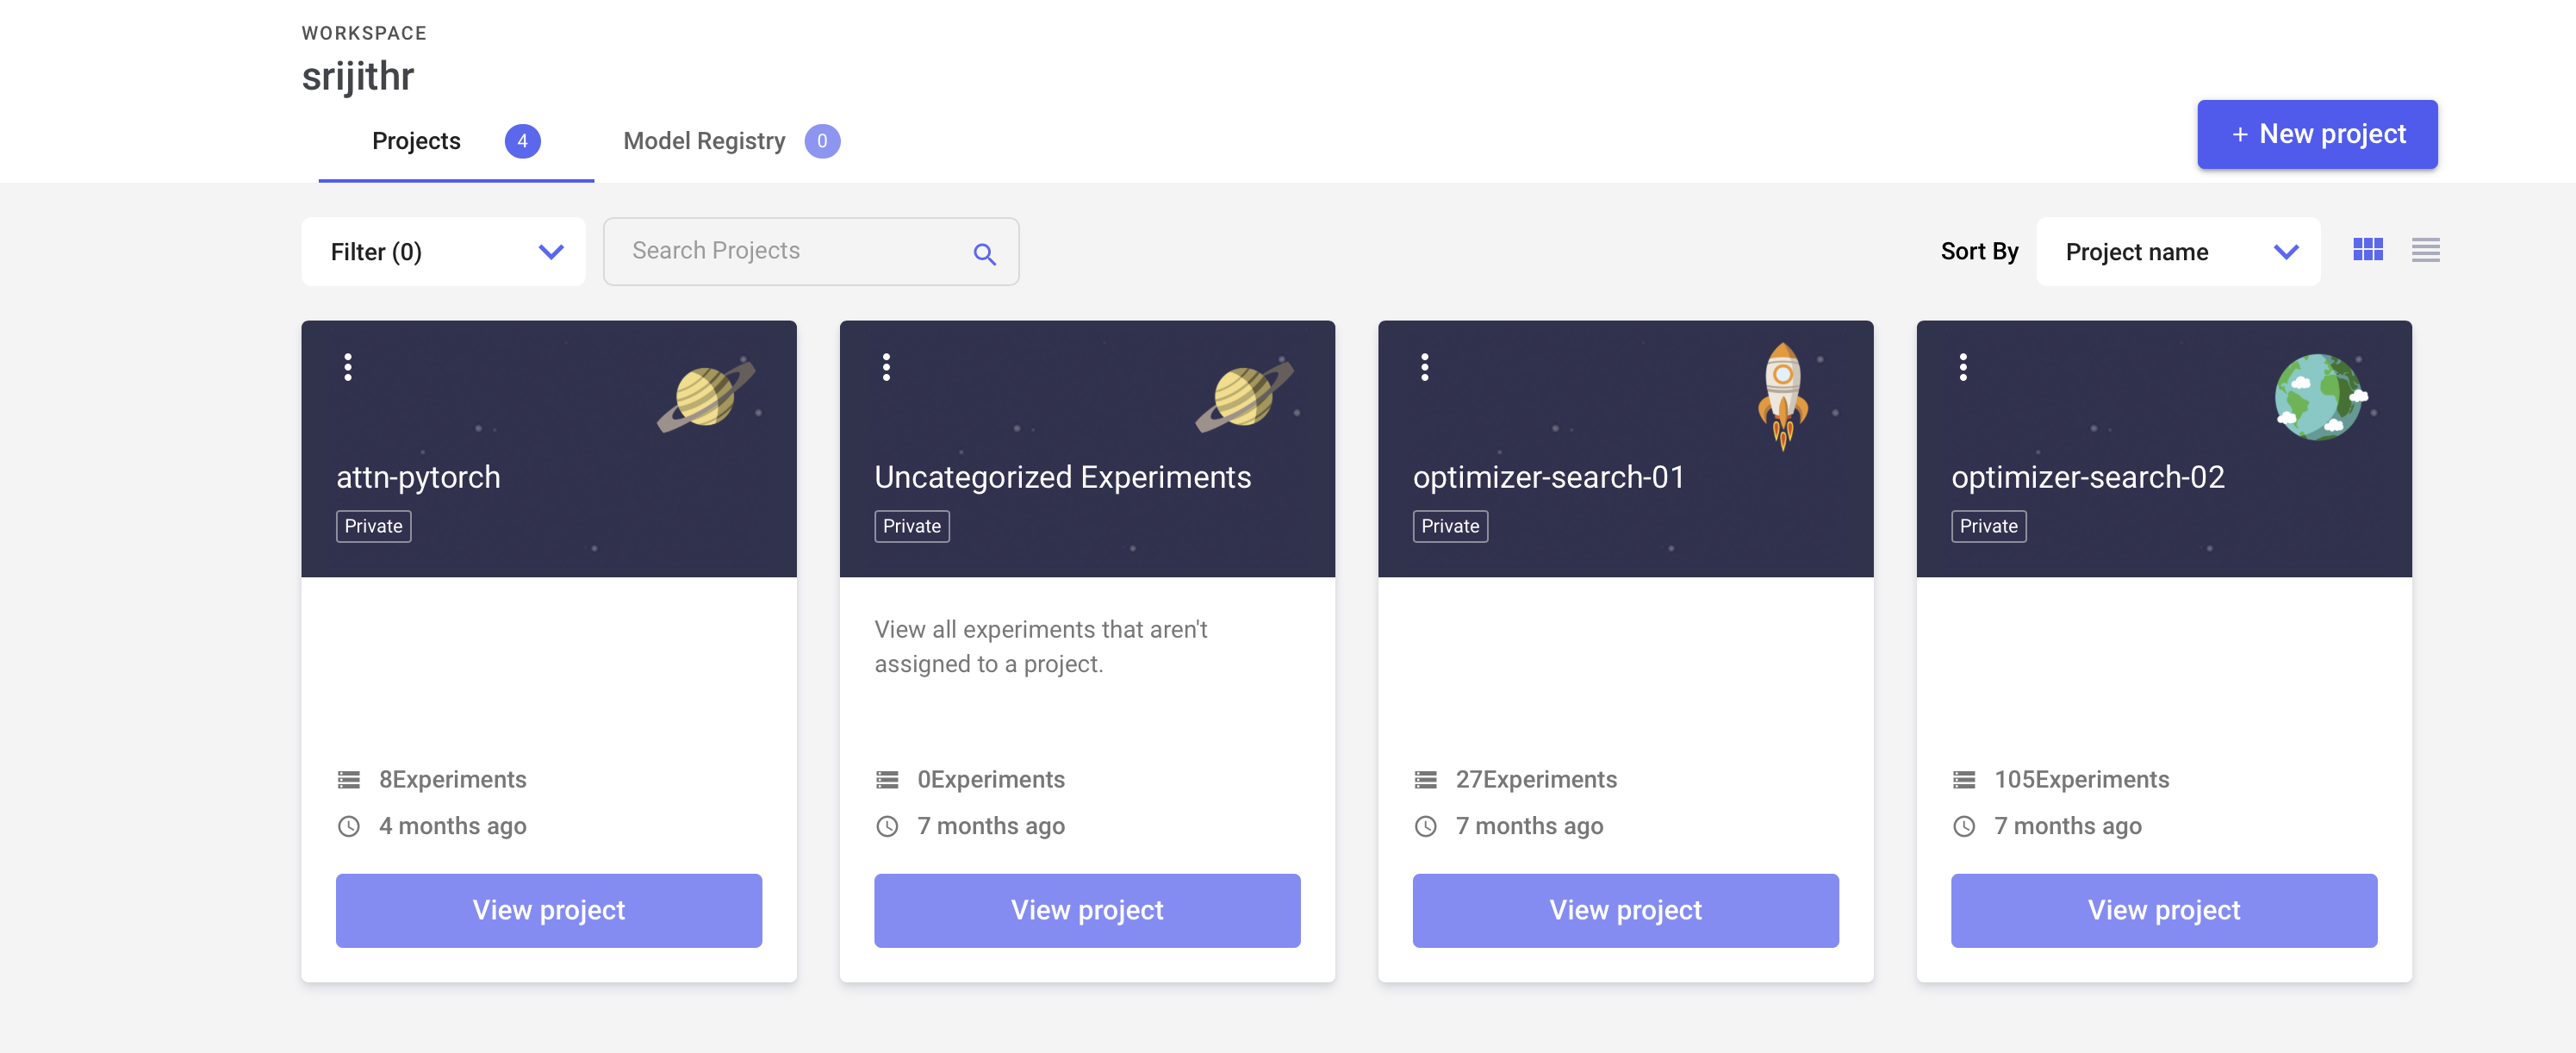
Once you log in to Comet.ml, you are greeted with the interface that lists all your projects.
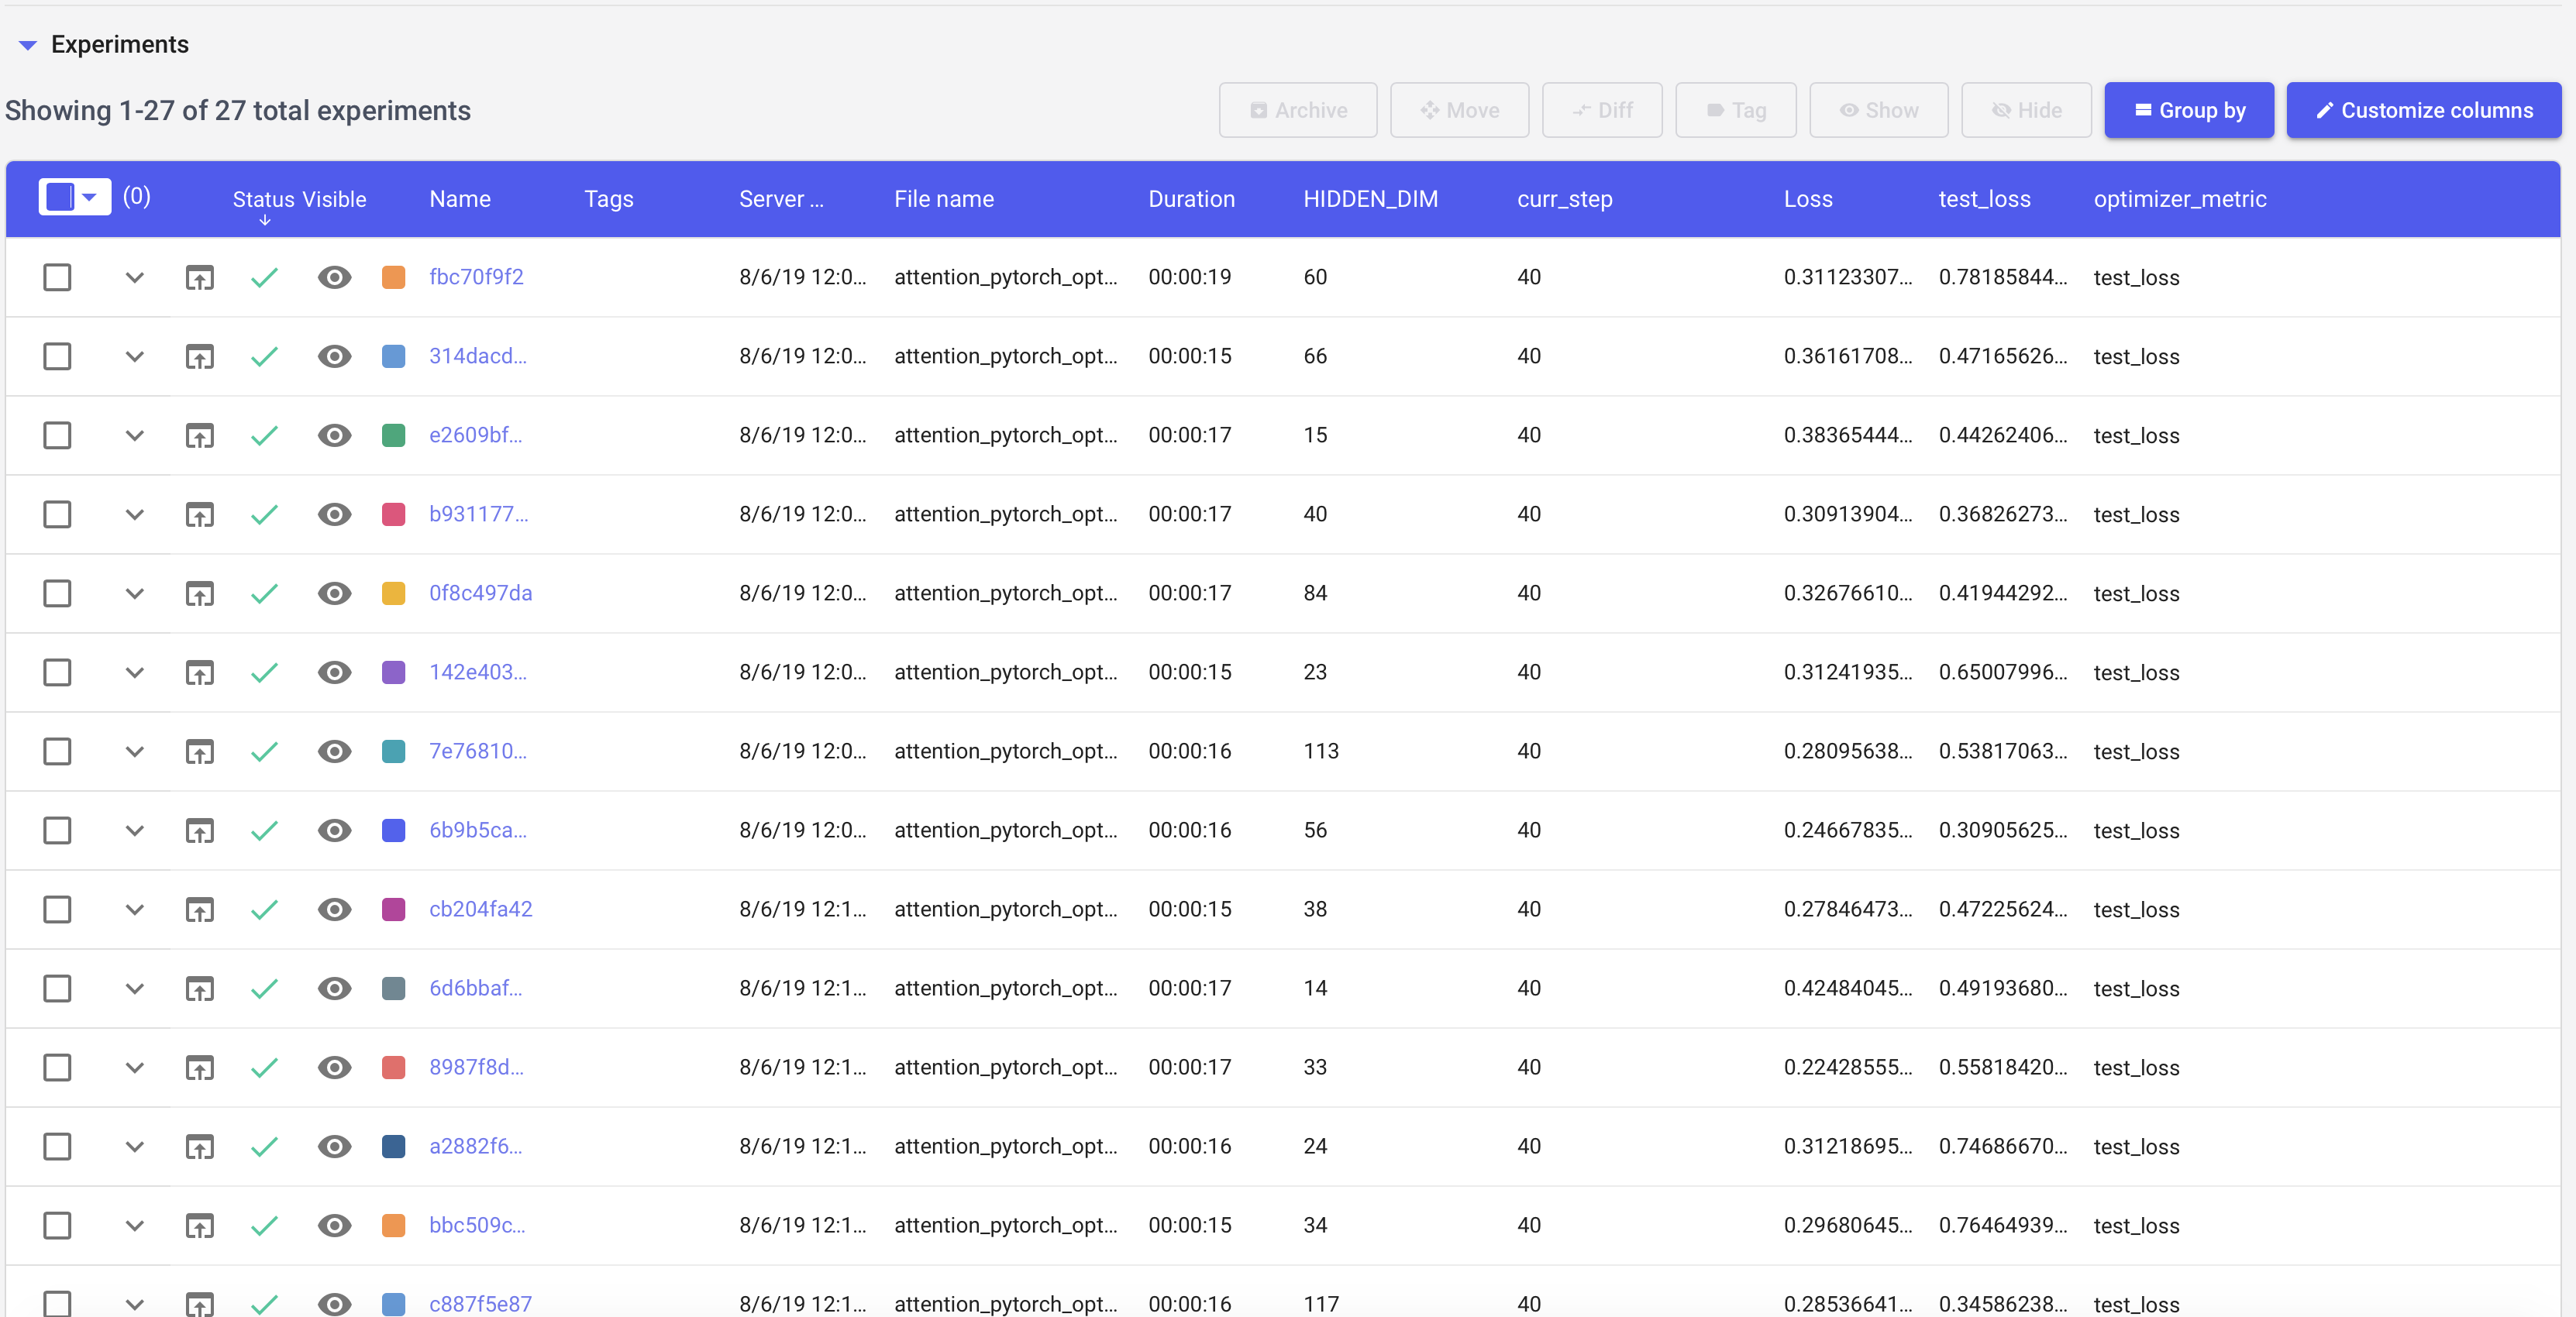
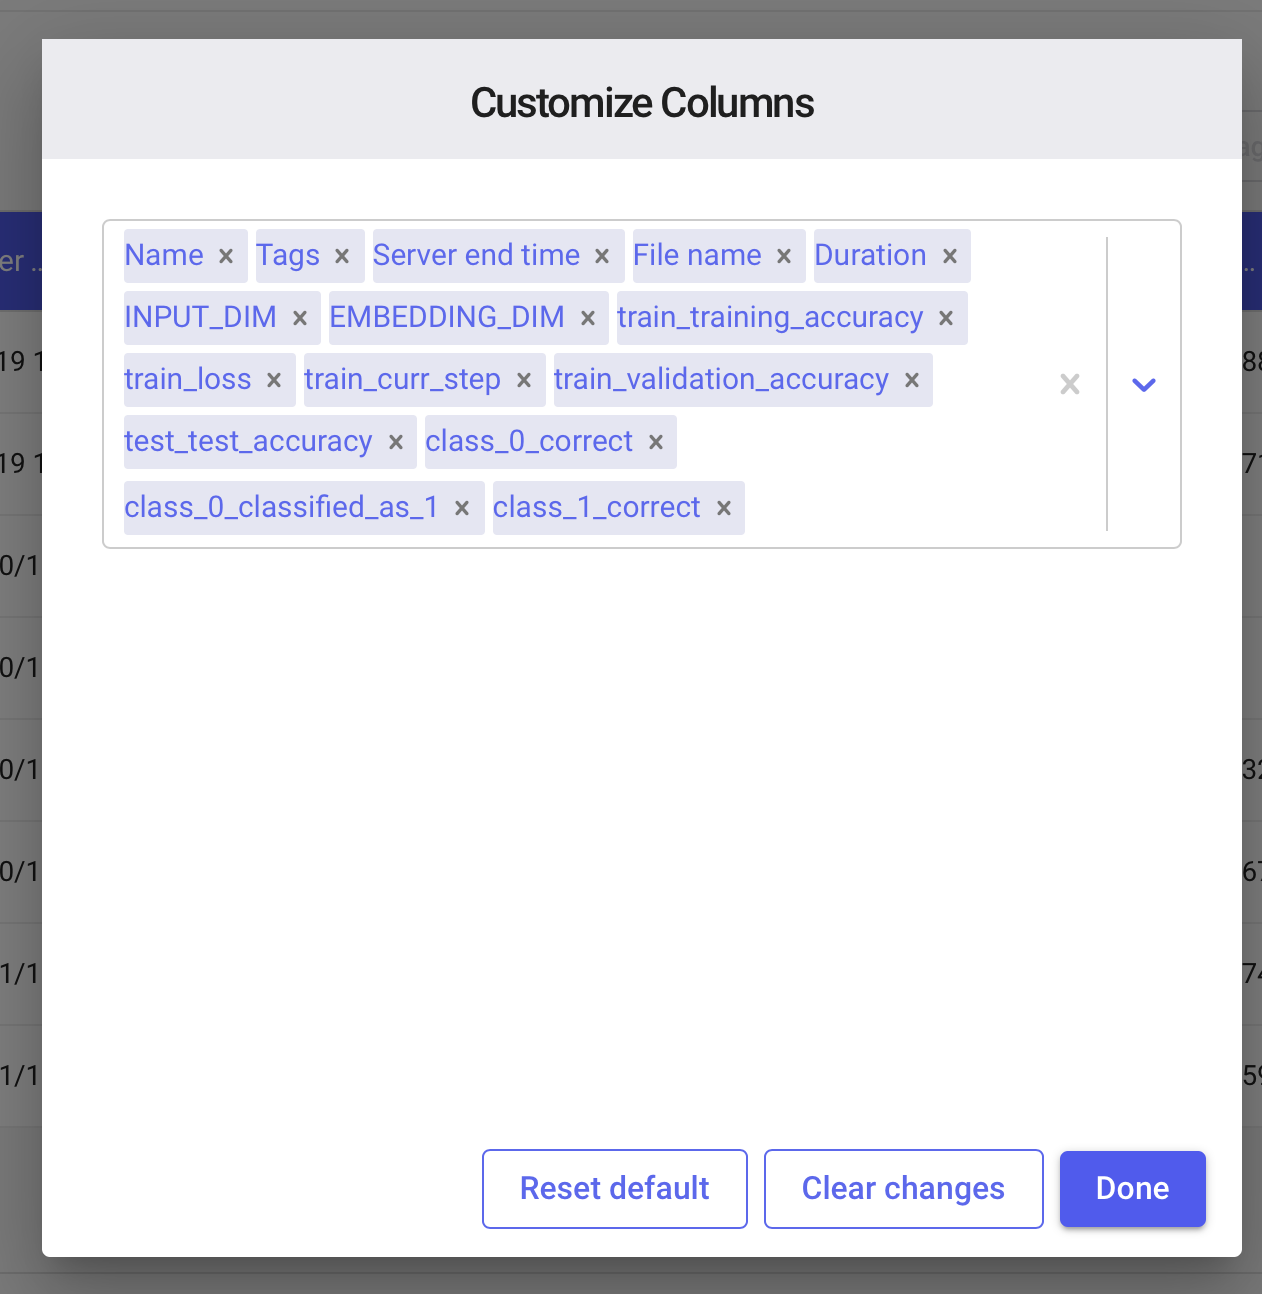
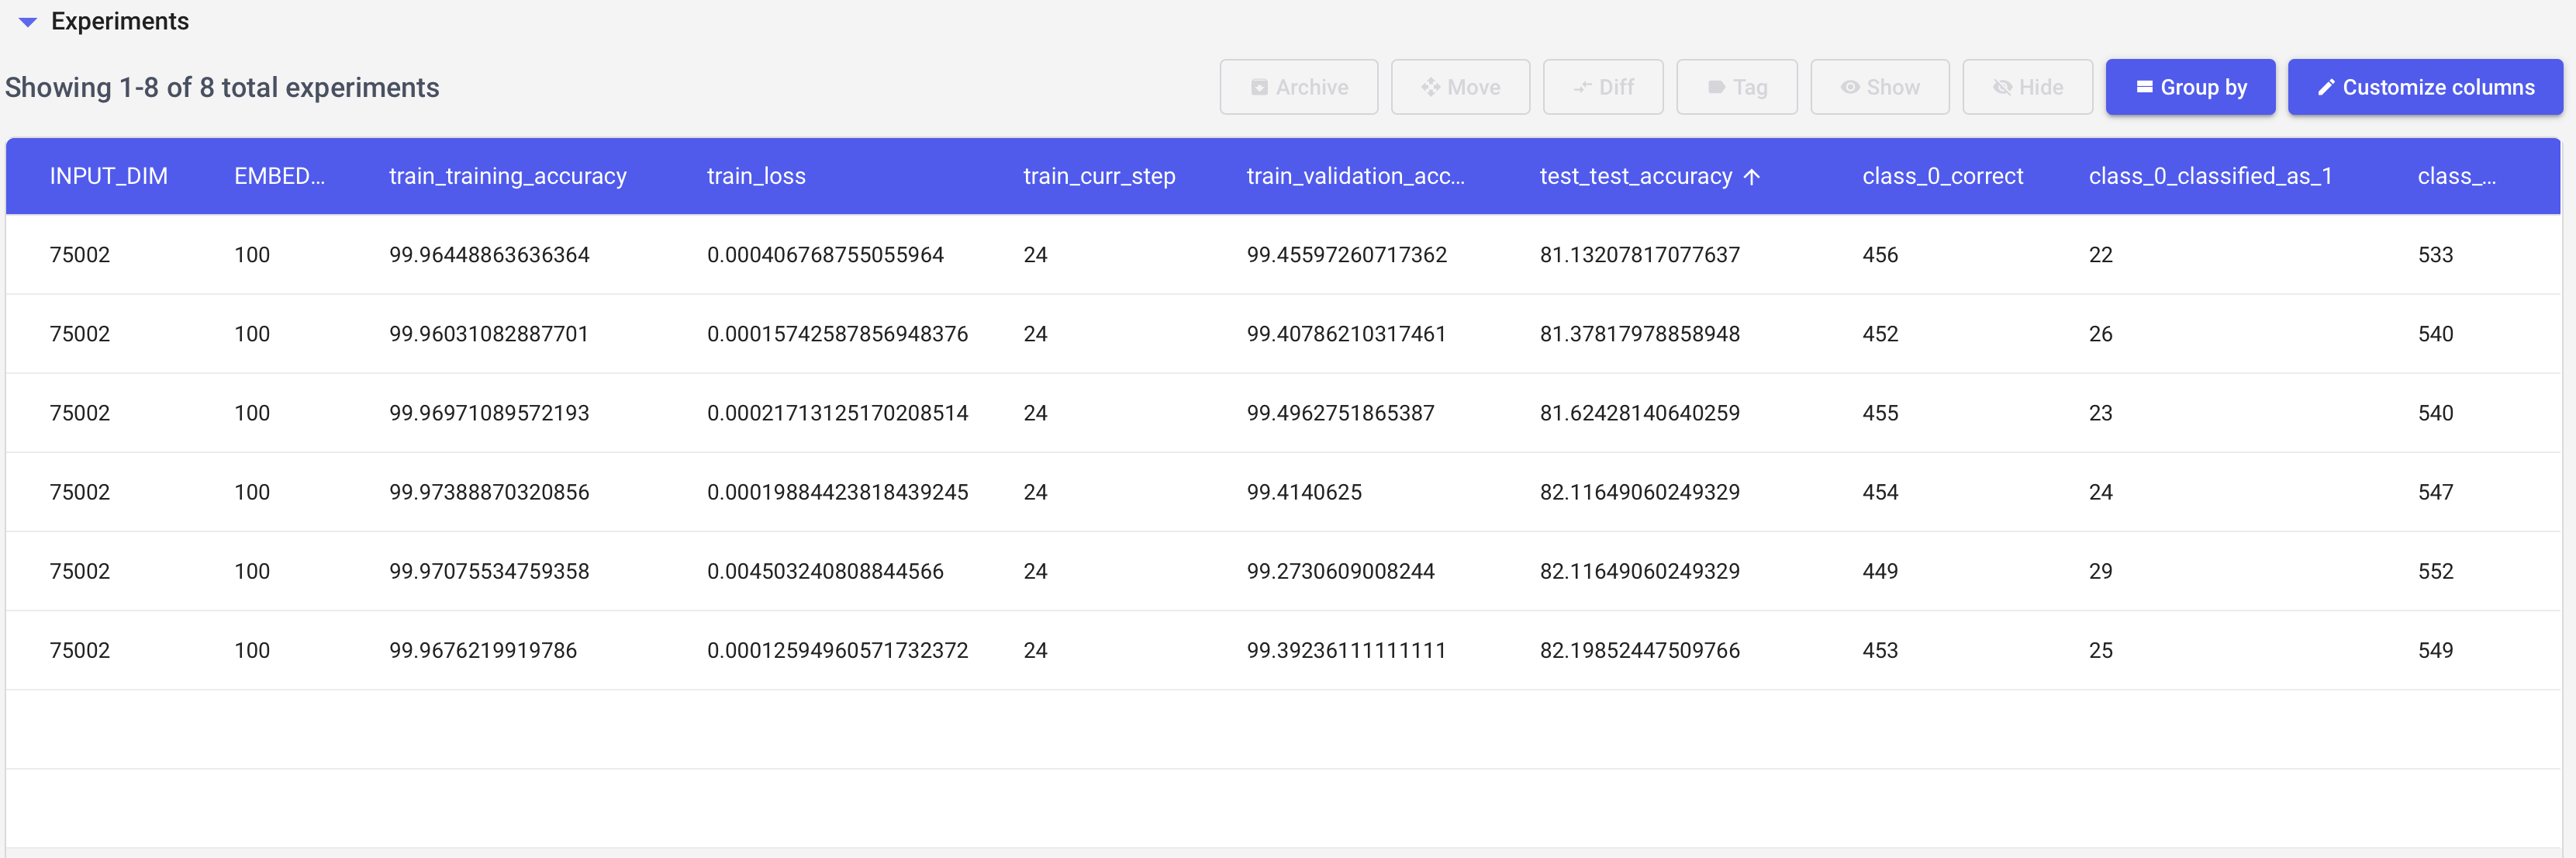
Clicking on a project brings you to a page with your program runs which are listed as a table (Fig. 4). You have the option to customize your columns (Fig. 5). You can add tags to your runs which also enables filtering. Additionally, you can add extra variables that you want logged using the ‘log_metric’ or ‘log_metrics’ methods. The former logs individual values while the latter logs a dictionary of values. The ‘log_text’ method is useful for annotating text associated with a run while ‘log_figure can be used to log figures or charts. The ‘log_html’ method can be used for creating HTML reports or an interactive Plot.ly image. Version control and log your dataset information with ‘log_dataset_info’.
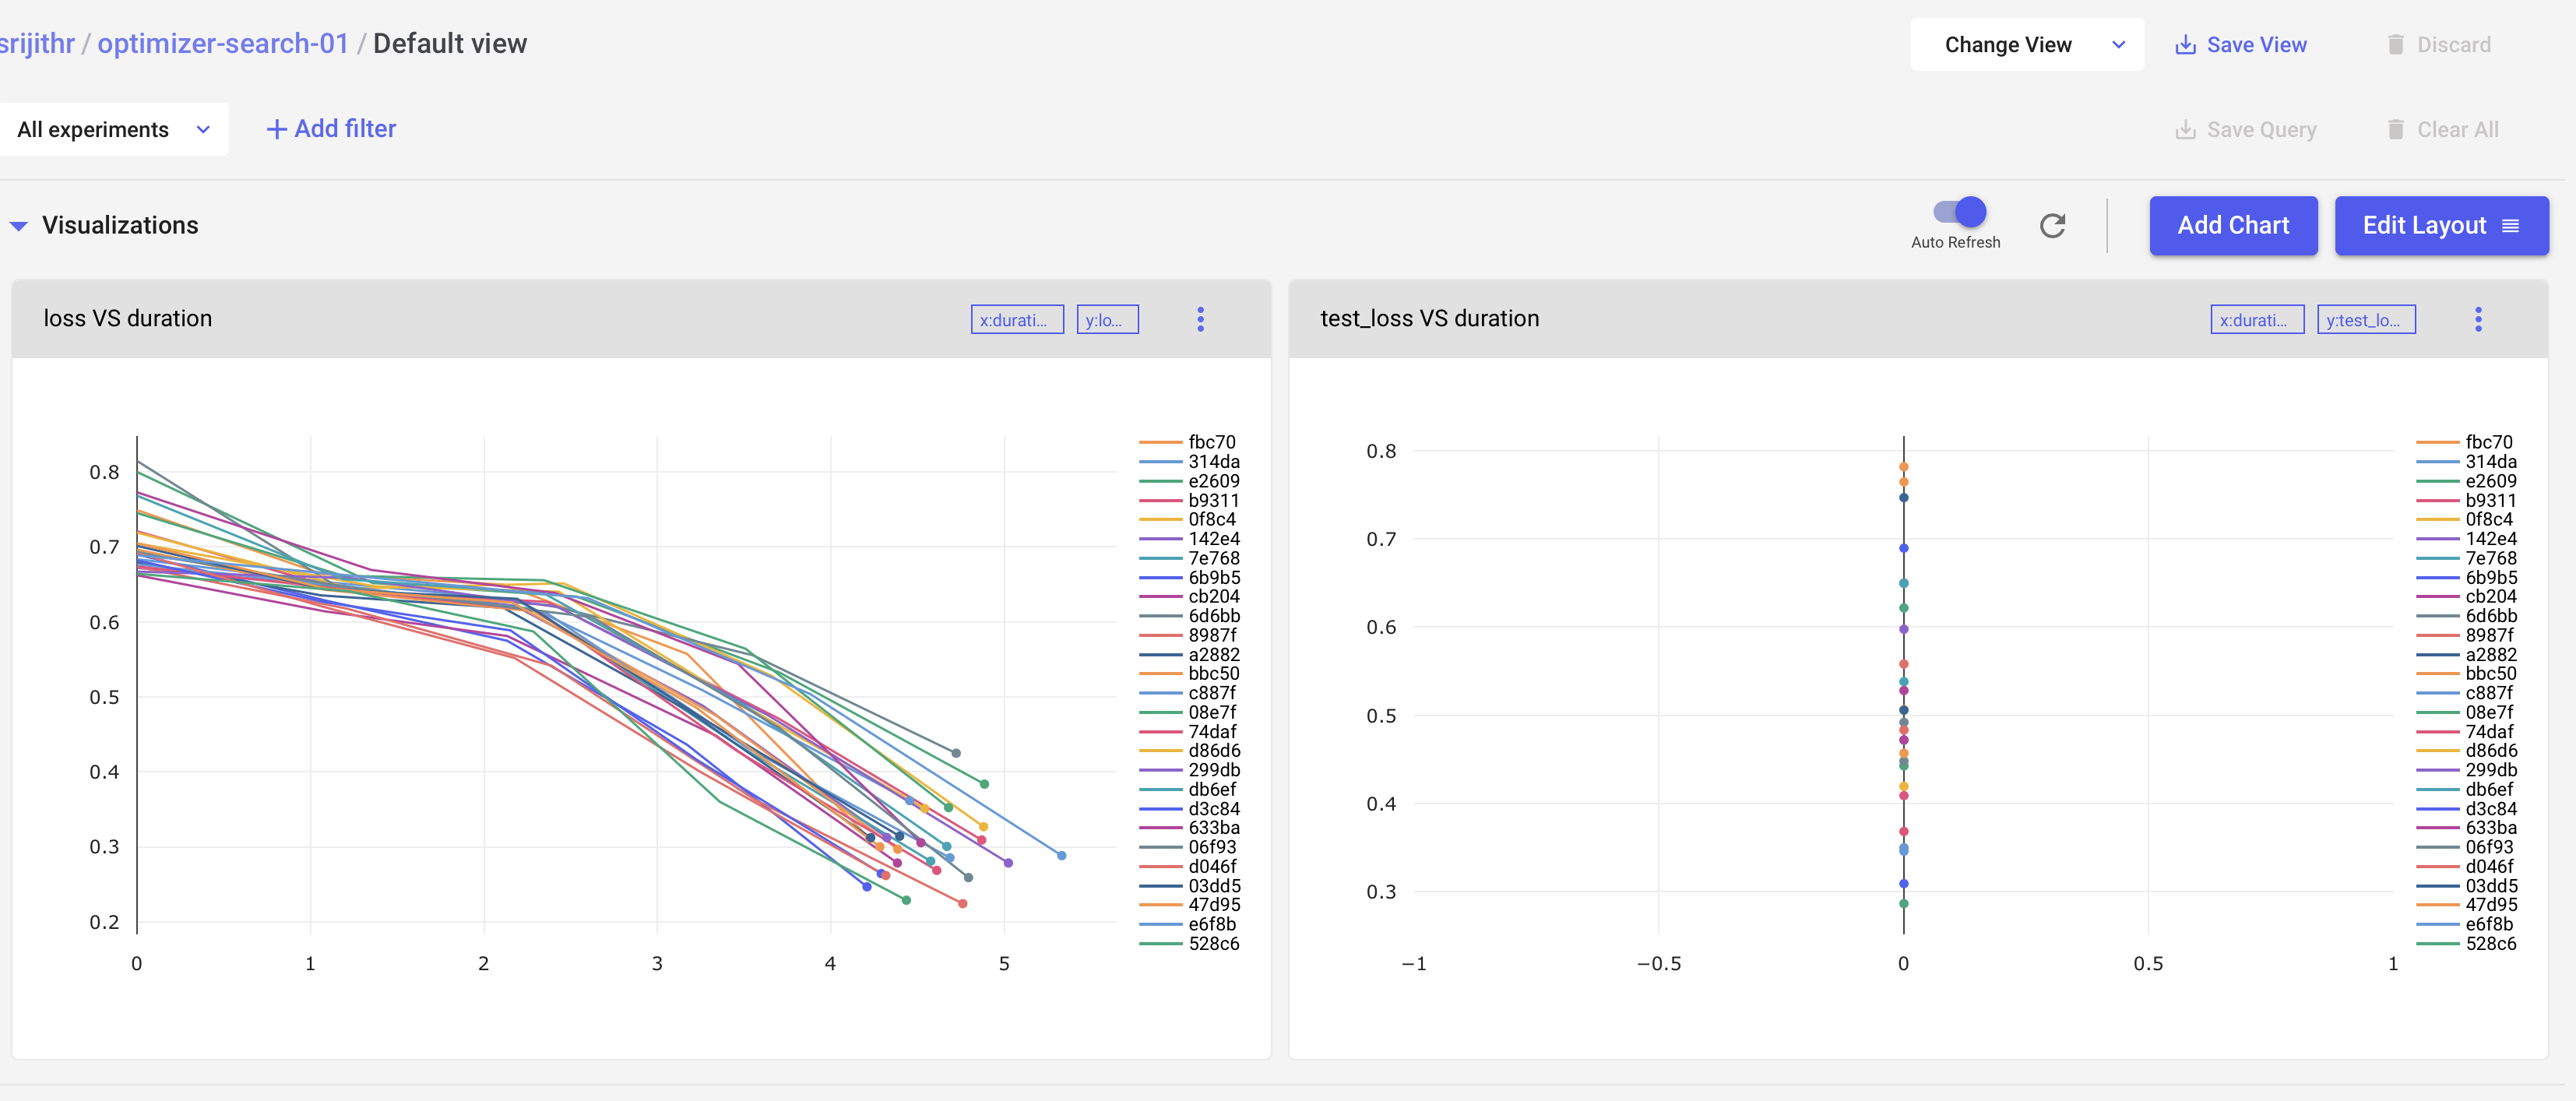
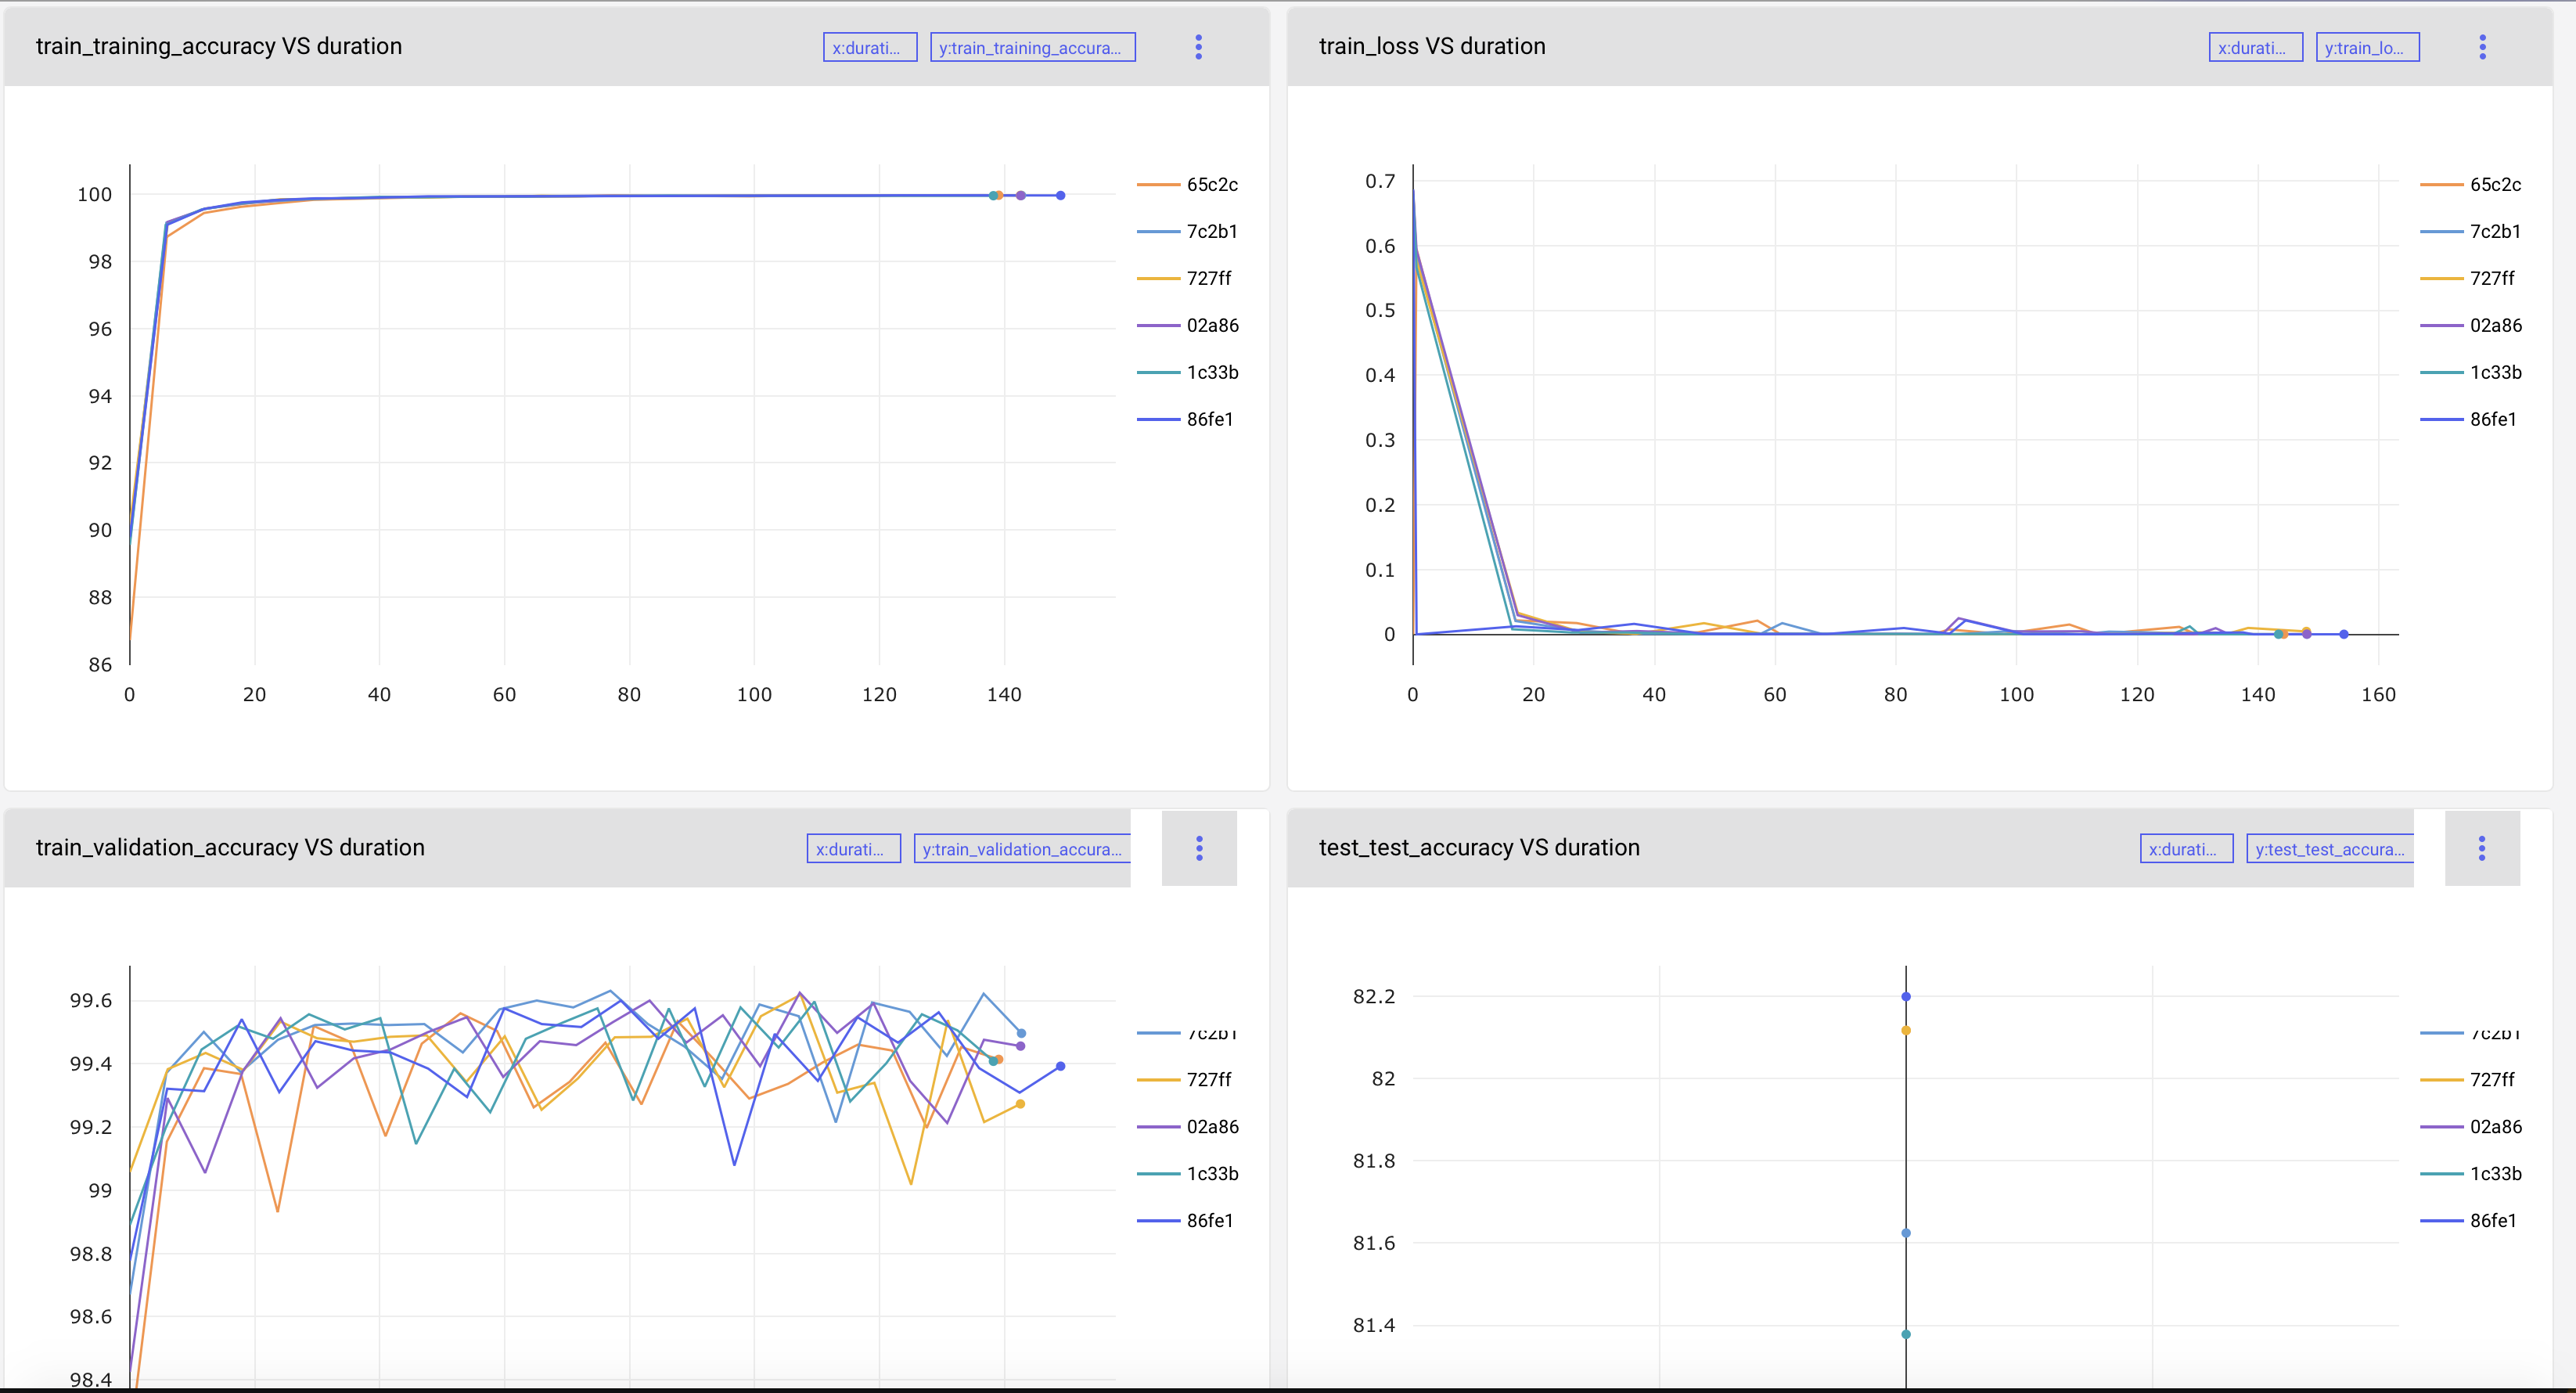
Add charts to visualize your metrics over epochs (Fig. 7 and Fig. 8).
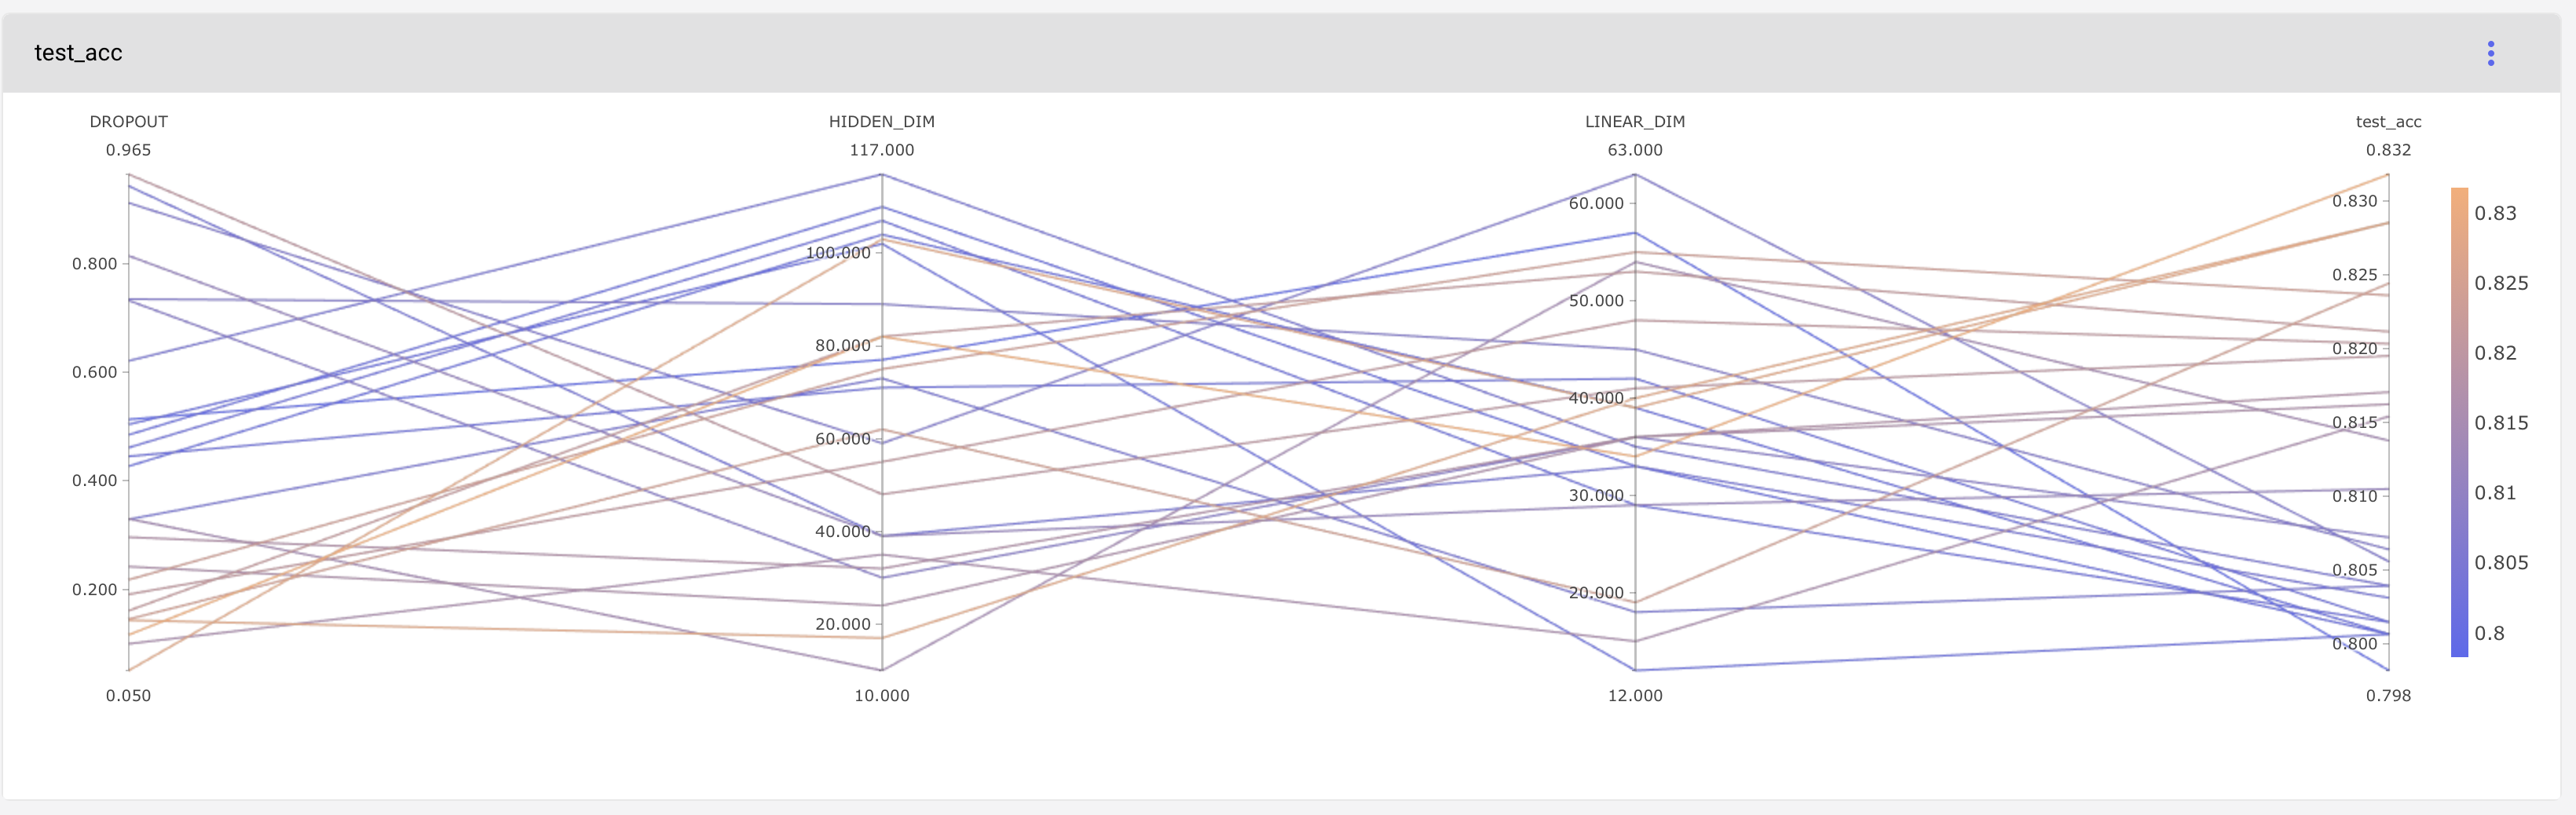
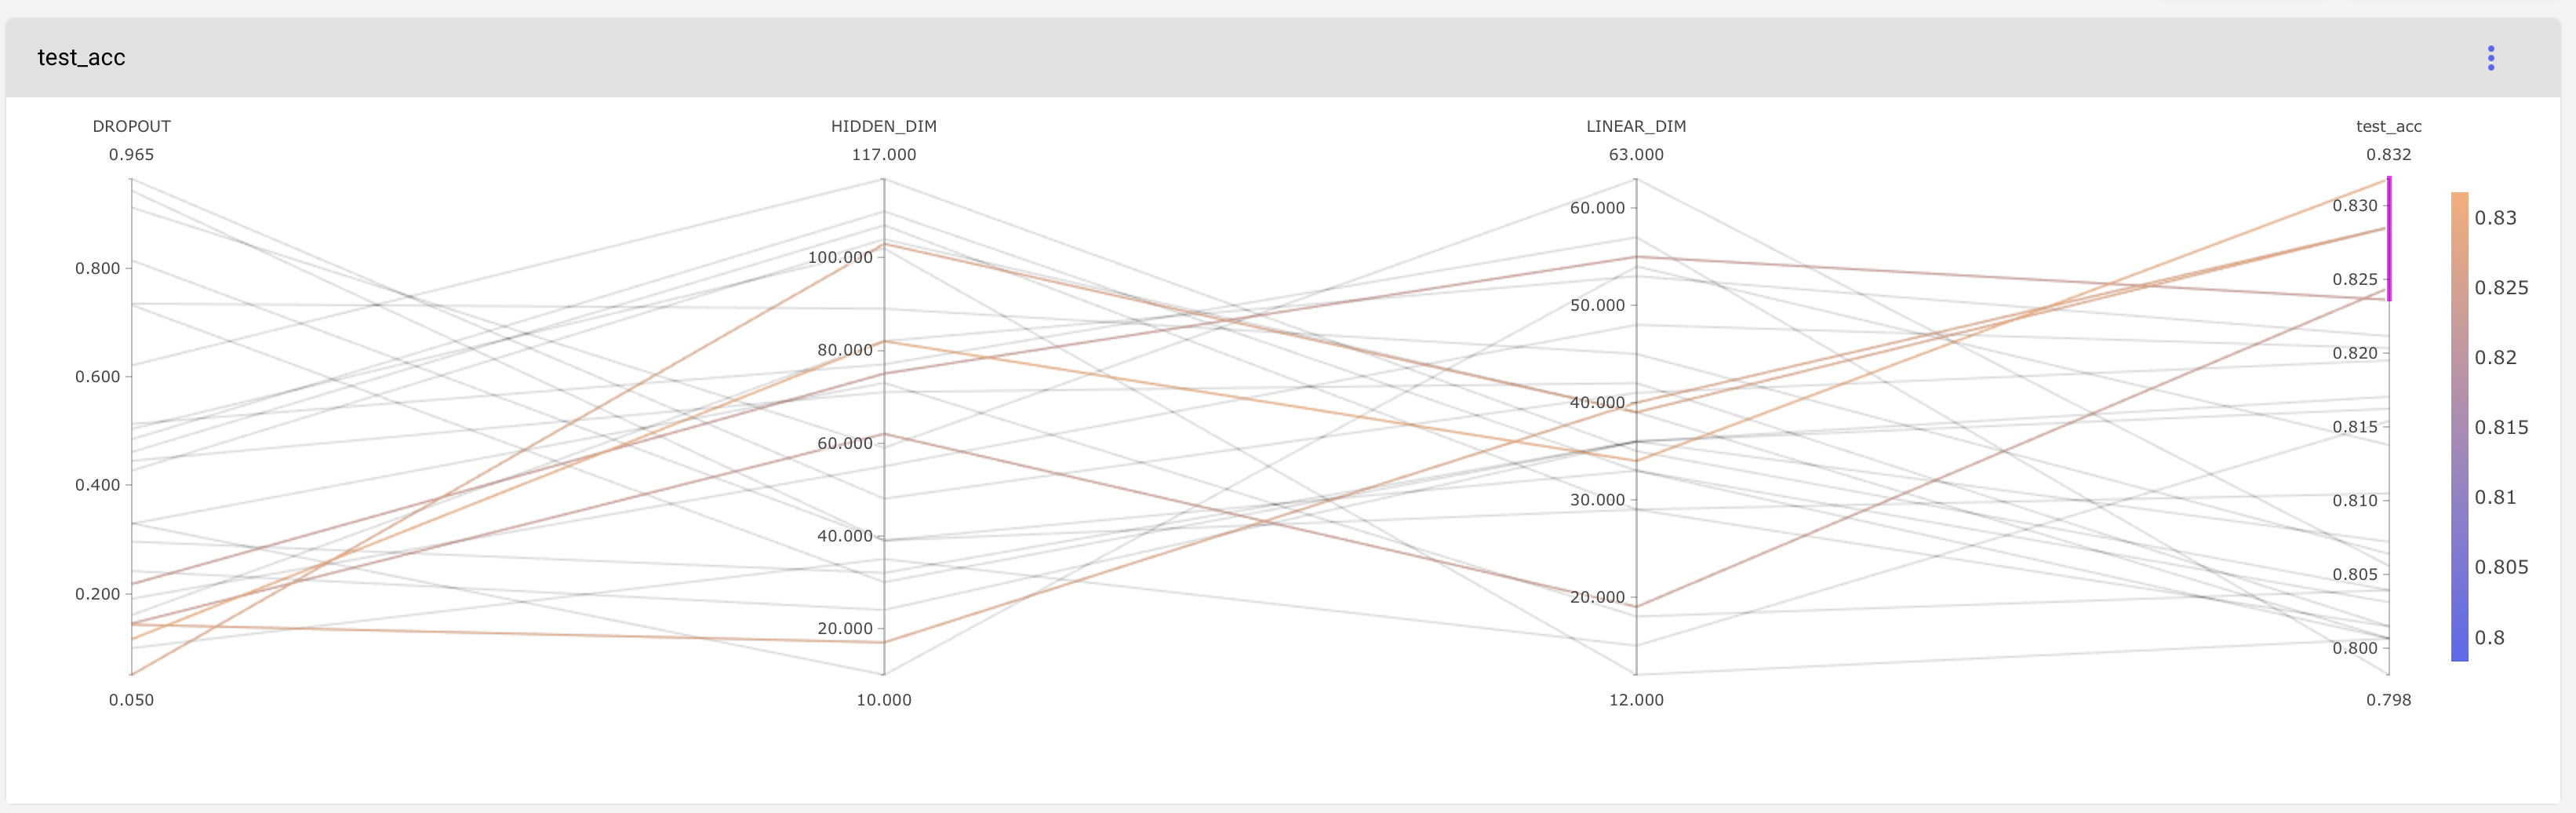
Parallel coordinates are particularly useful for analyzing your hyperparameter optimization runs. The interactive version of these visualizations allow you to filter for combinations of hyperparameters that maximize your optimization objective.