Table of Contents
3. How I used Neptune in my Keras ML project
Introduction
Neptune.ml is a workflow management and collaboration tool for Data Science and Machine Learning (DS/ML). I have had the pleasure of testing this platform out for my own work and I must admit that I am convinced that every Data Science team needs something like this. In my workflow, the ability to perform systematic experimentation with my Machine Learning models helps immensely especially when it is time to write that research report or paper. As far as I can tell, the key capabilities for Neptune.ml are as follows:
- Annotation/Documentation of DS/ML experiments
- Per-experiment cataloging of model hyperparameters, code, model metrics (e.g. accuracy, F1-score, AUC etc.), model files, output files and output visualizations
- Versioning of data files
- Version control of Jupyter notebooks (standout feature)
- Collaboration of your workspace with your team
I am of the belief that Jupyter notebooks should primarily be used for the following use-cases:
- Prototyping and developing your algorithm
- Sharing and presenting your work to an audience
- Interaction with algorithms or models in an educational setting
If you need to version control research production or research code, I recommend a modular approach of creating a pipeline of modules in the Jupyter notebook where the individual modules themselves are version controlled in files and stored in your Git/Mercurial/SVN/CVS repository. However, even in that approach I can still see a need for versioning Jupyter notebooks.
This and is not meant to be a review but rather a gentle introduction to Neptune.ml. I have tried a provide a ‘not so comprehensive’ overview of the capabilities and how I have used this tool in my work.
Overview of Neptune’s Interface
I briefly cover the main components of Neptune’s interface here, this is not meant to be a comprehensive overview of Neptune’s capabilities.
Wiki page
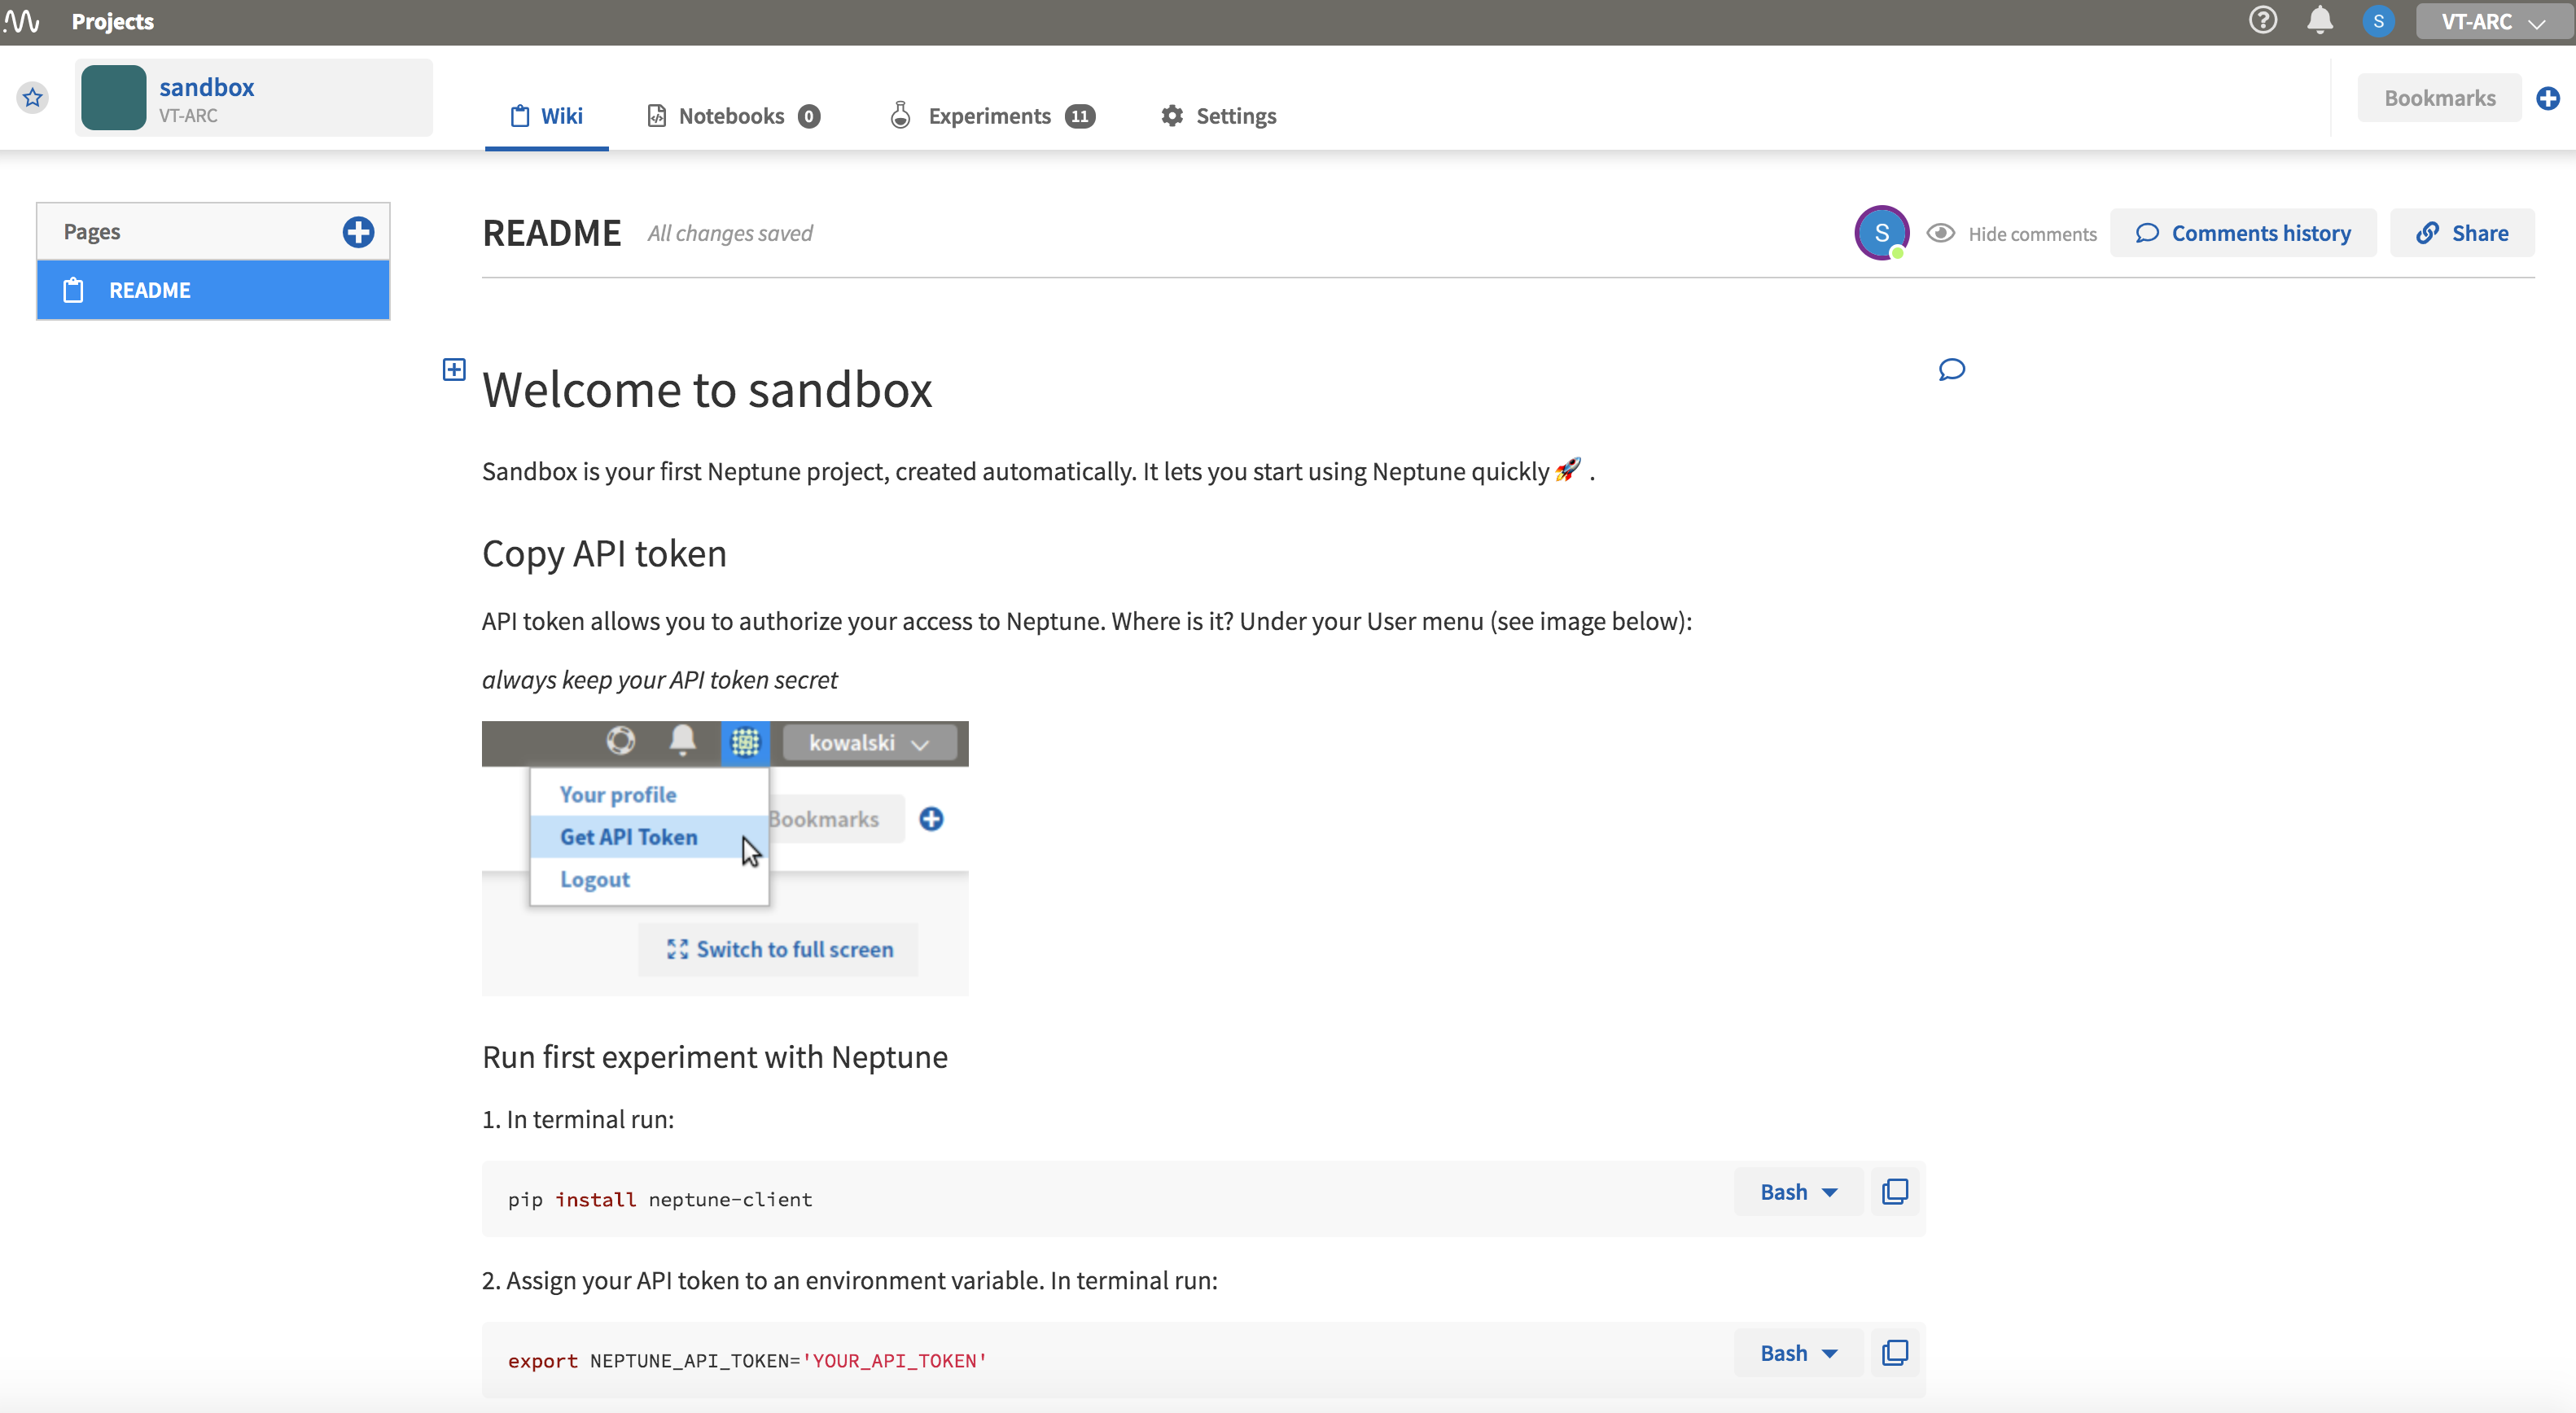
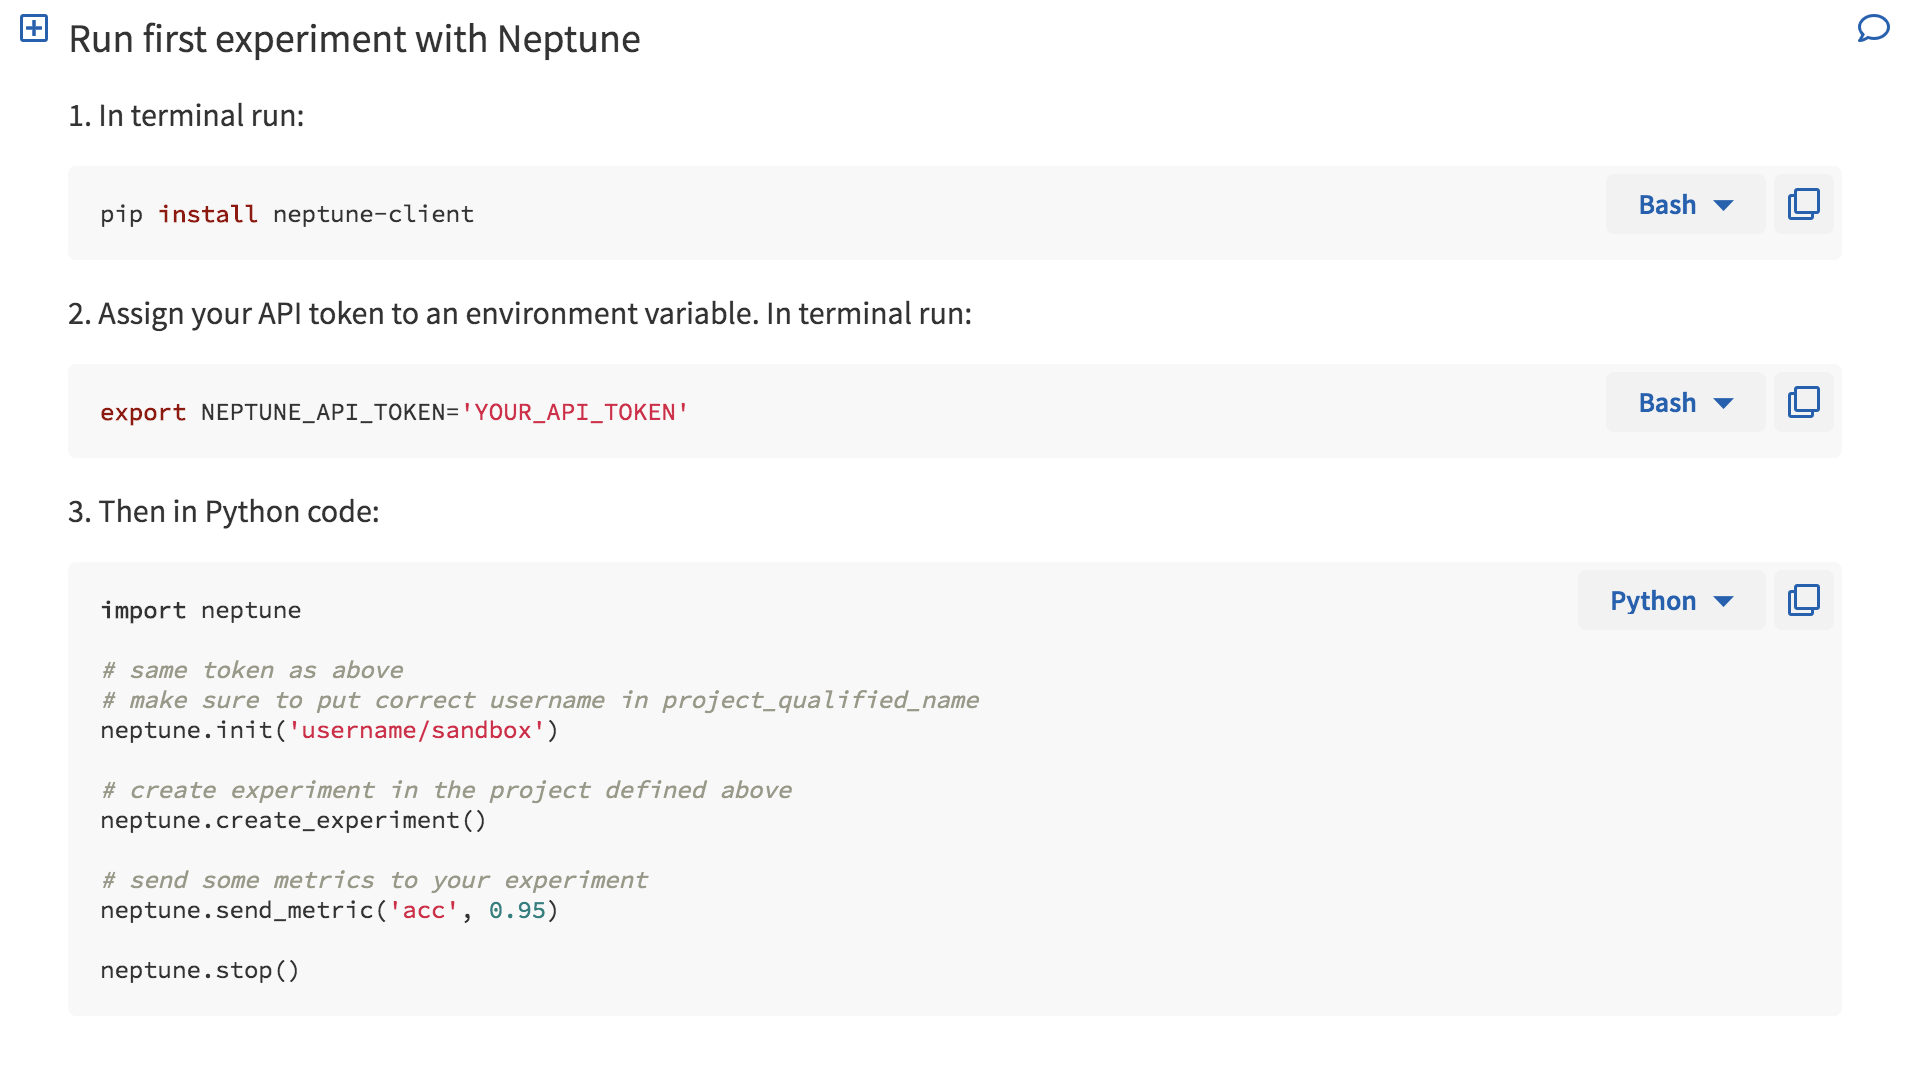
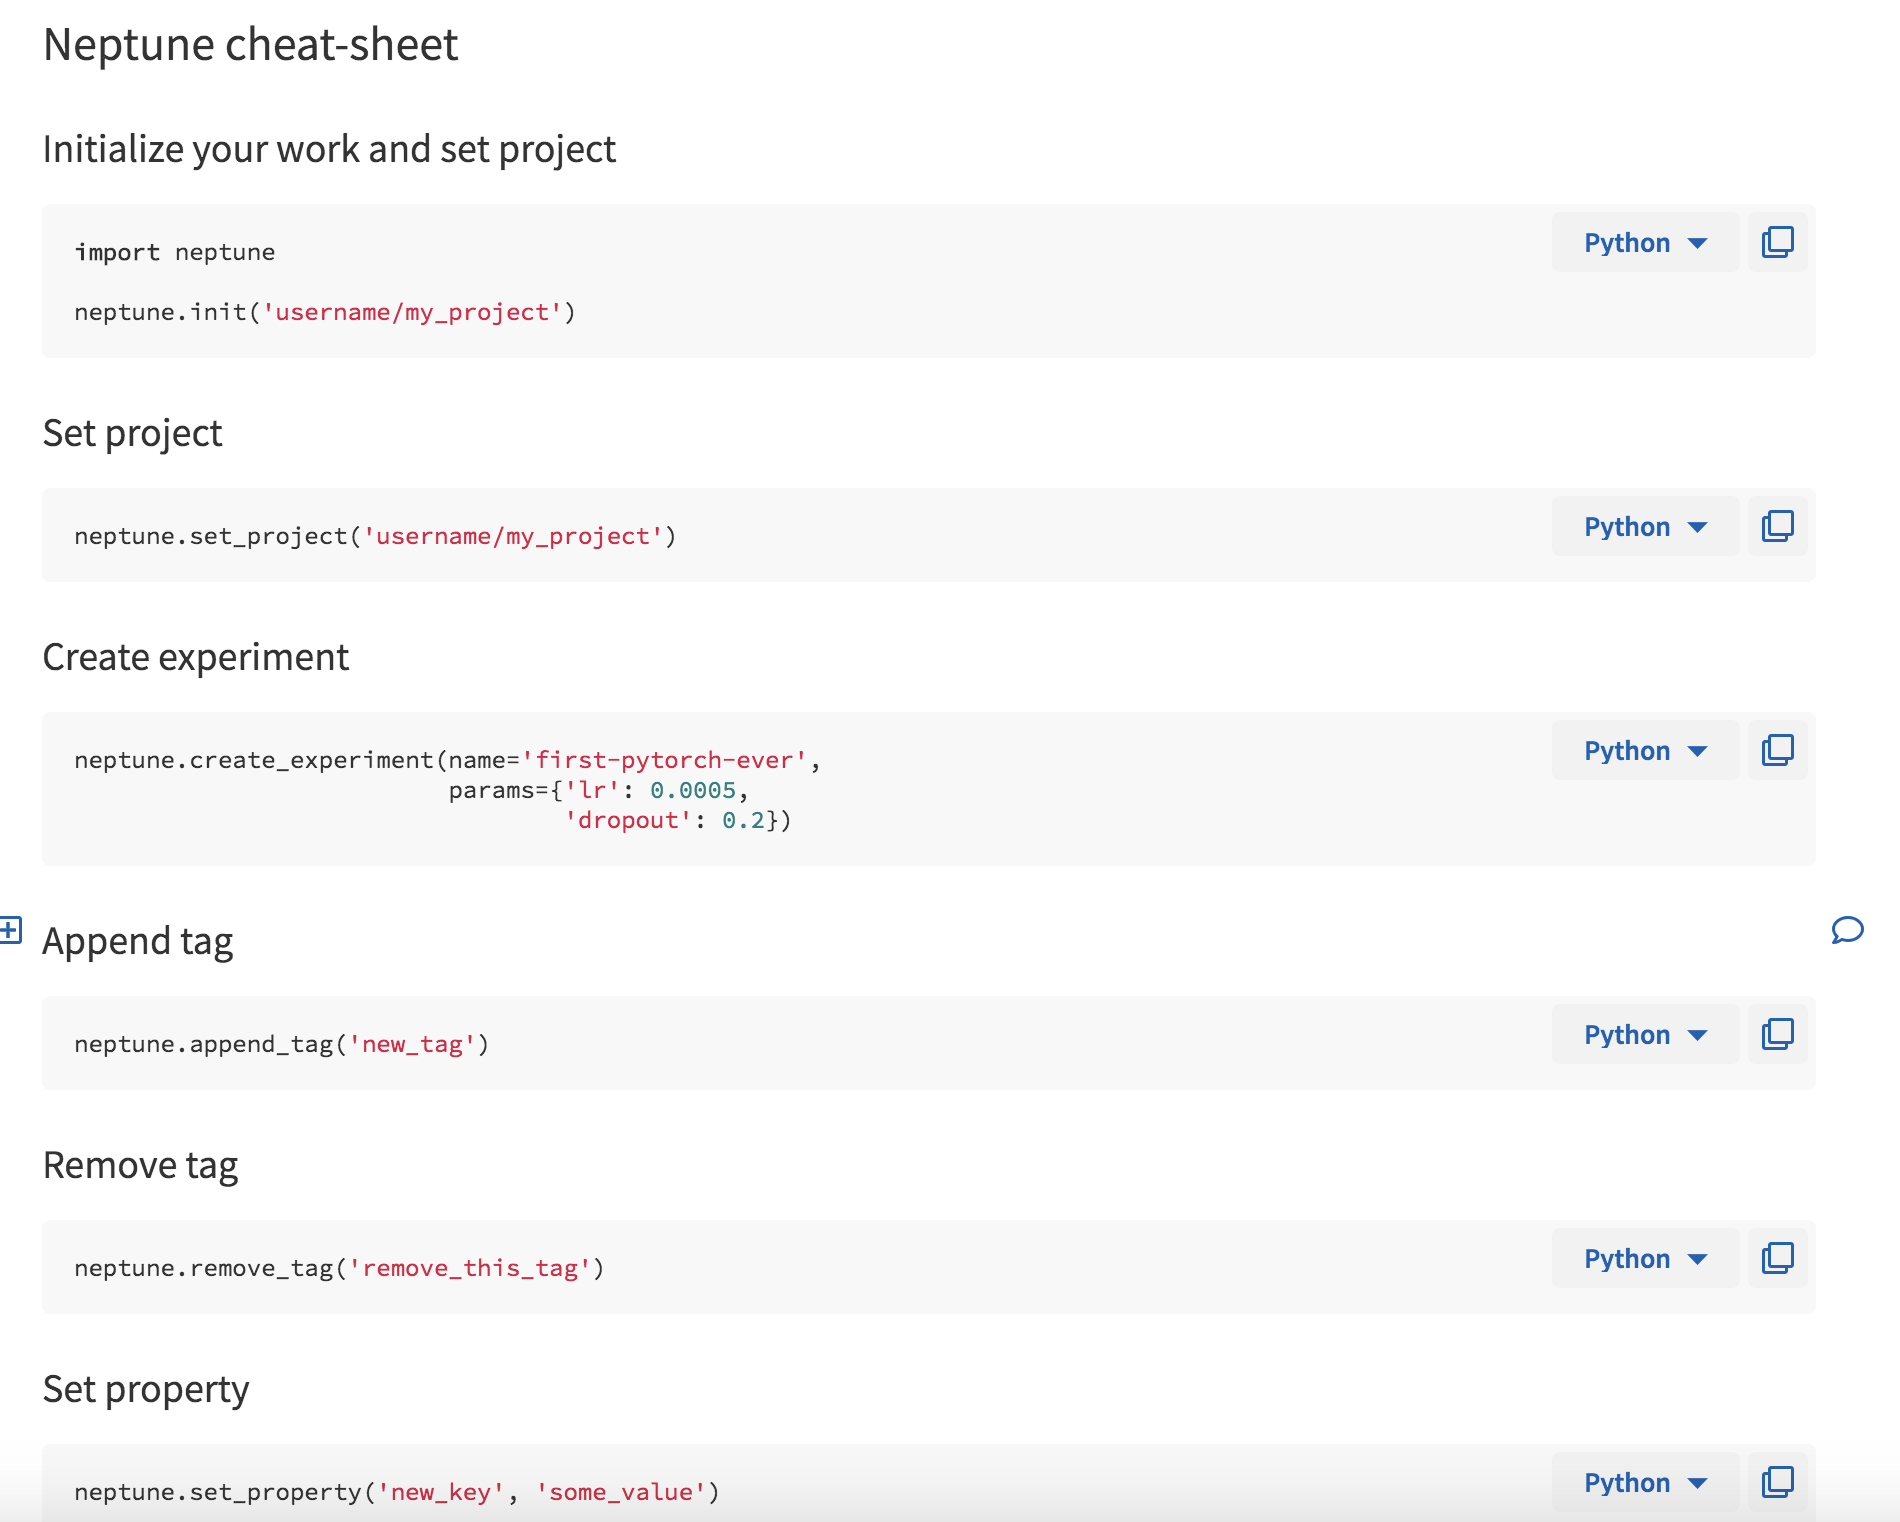
When you first log in, you are greeted with a Wiki page (Fig. 1) that happens to a minimal set of instructions to get you started (Fig. 2). There is also a quick cheatsheet that shows you some of the functionality of Neptune’s API (Fig. 3). Additional wiki pages can be created for annotating experiments or just sharing project information. The wiki pages are written in Markdown and the editor helpfully has autocomplete enabled to make this process easier.
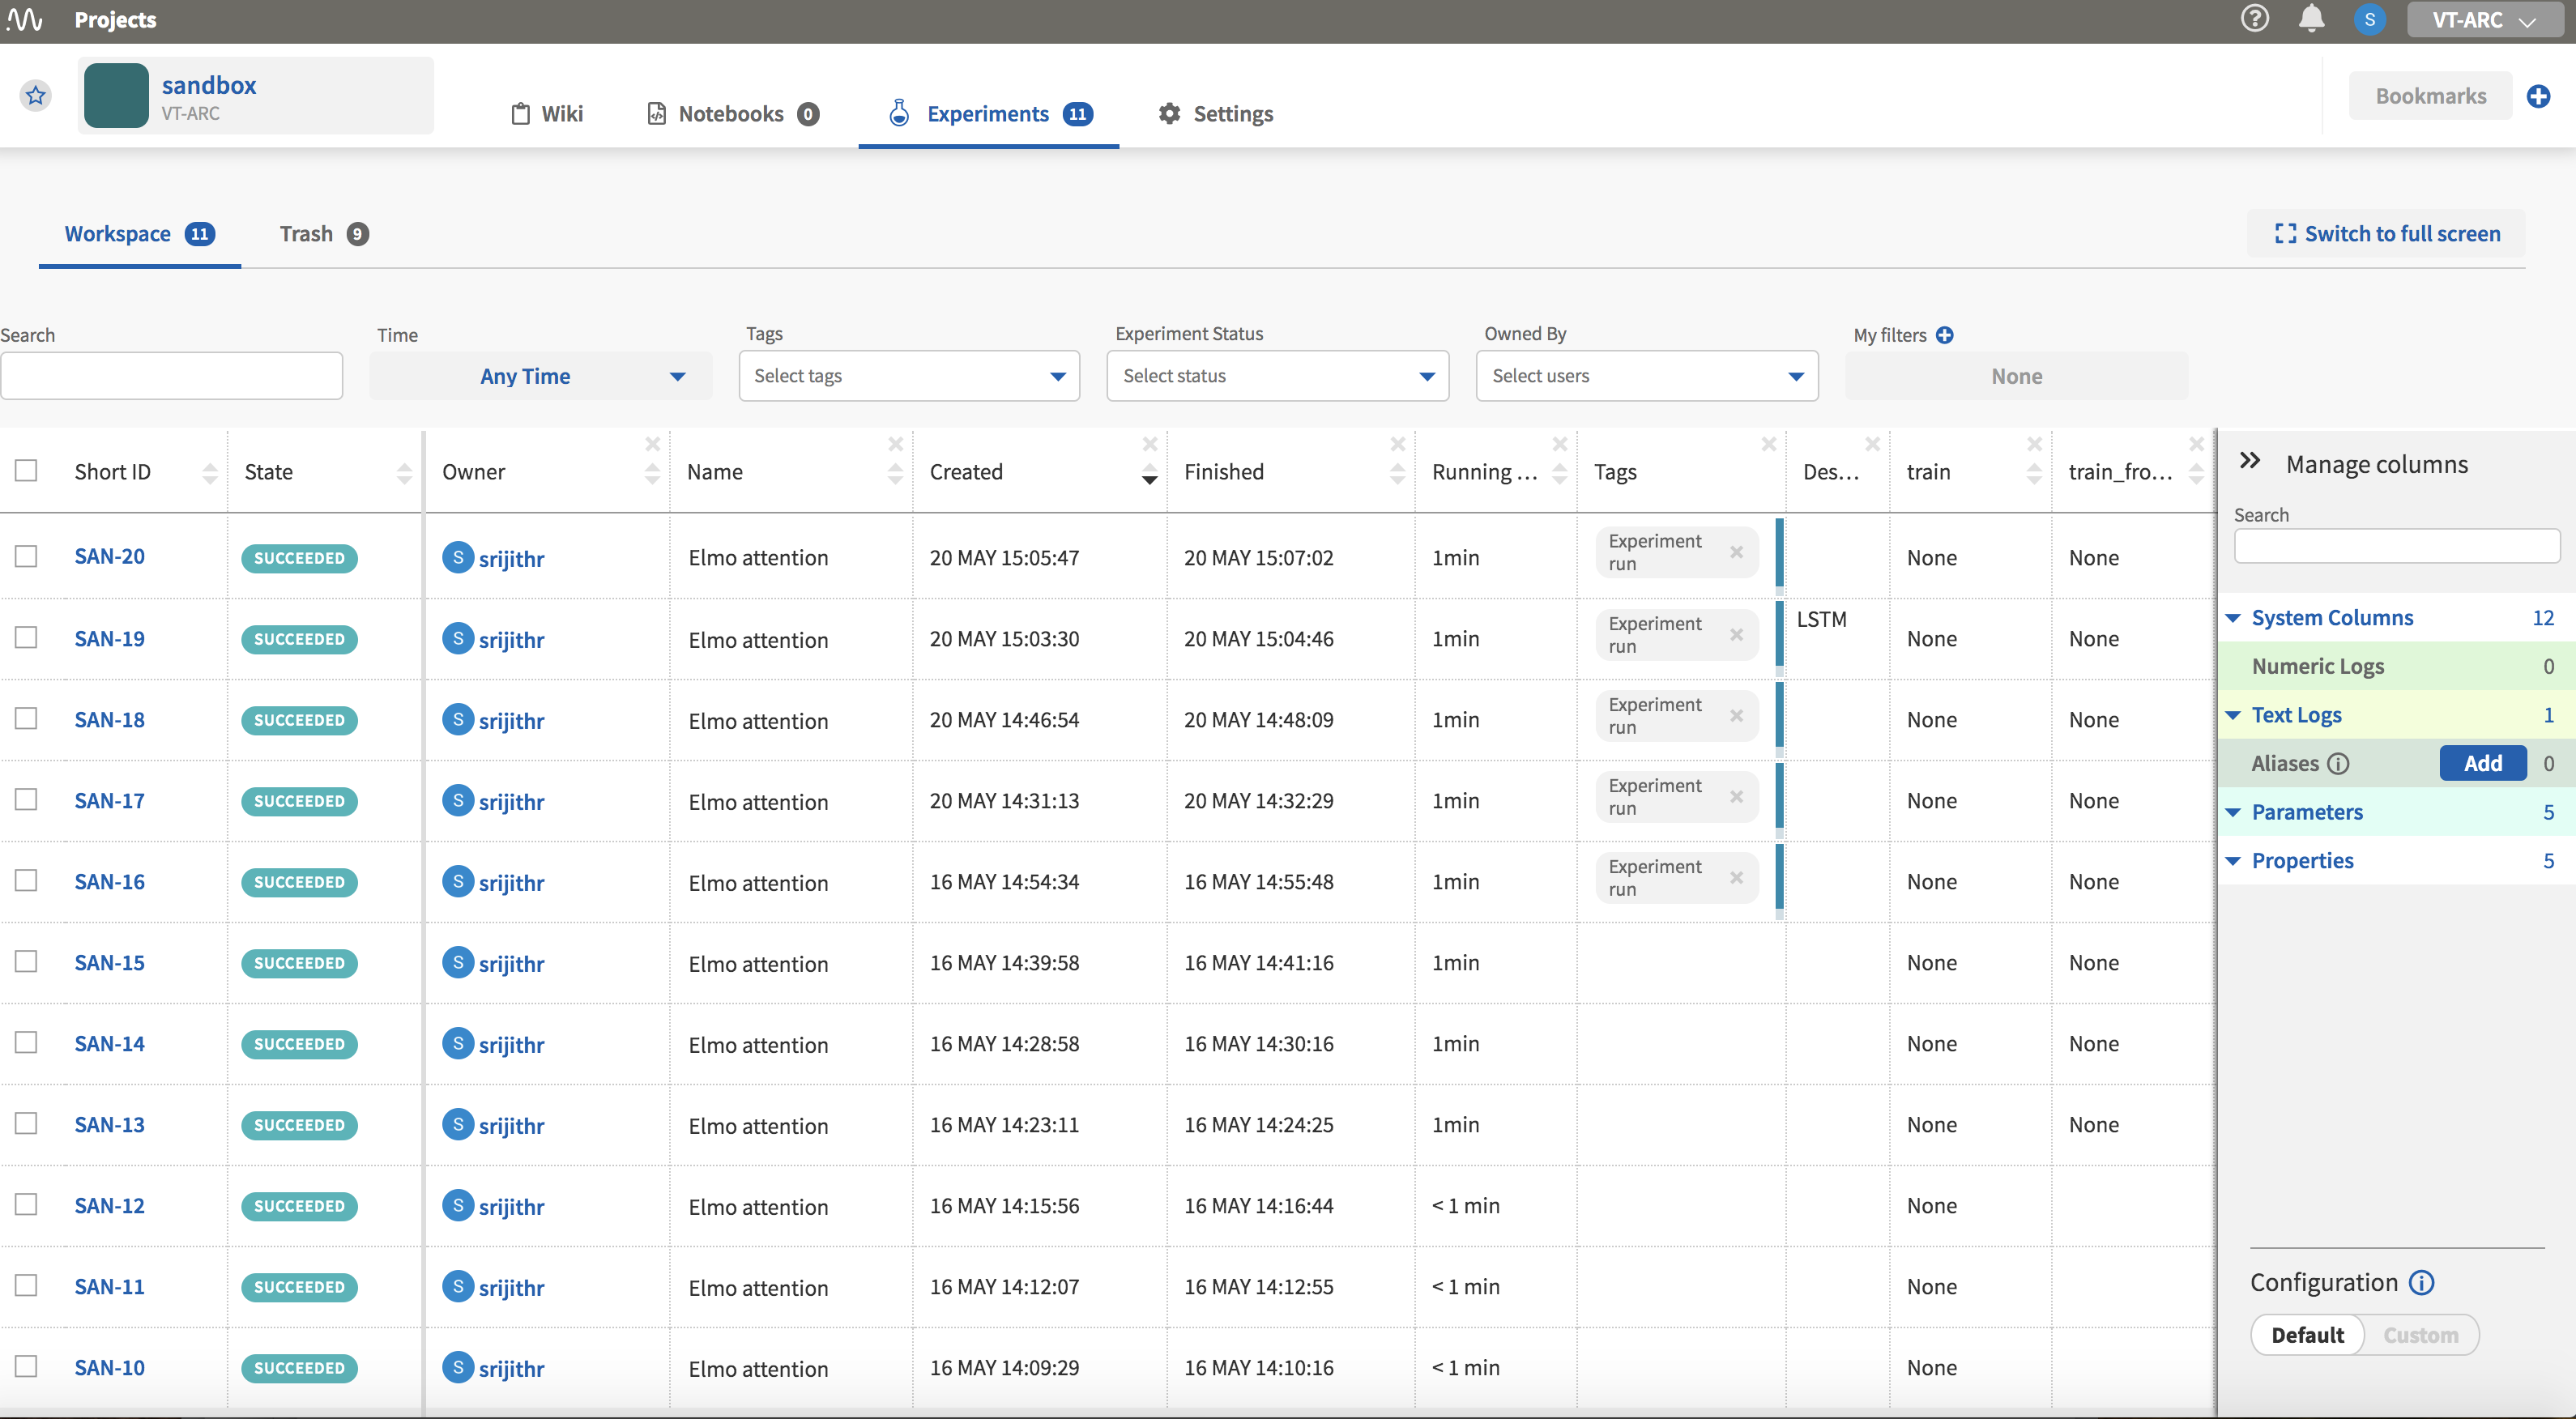
The experiment page is shown in Fig. 4 and it consists of a table of your model runs with the associated information in columns. Columns can be added or removed to customize the view. These columns can be selected from the right side pane titled ‘Manage columns.’ Clicking on each individual experiment ‘Short ID’ will take you the page for that particular experiment which has more detailed information.
Experiment page
How I used Neptune in my Keras ML project
Your experiments show up in the table after they have finished execution with an ID, State (indicating success or failure), the start and end times among to name a few. The records can be sorted by clicking on the column names.
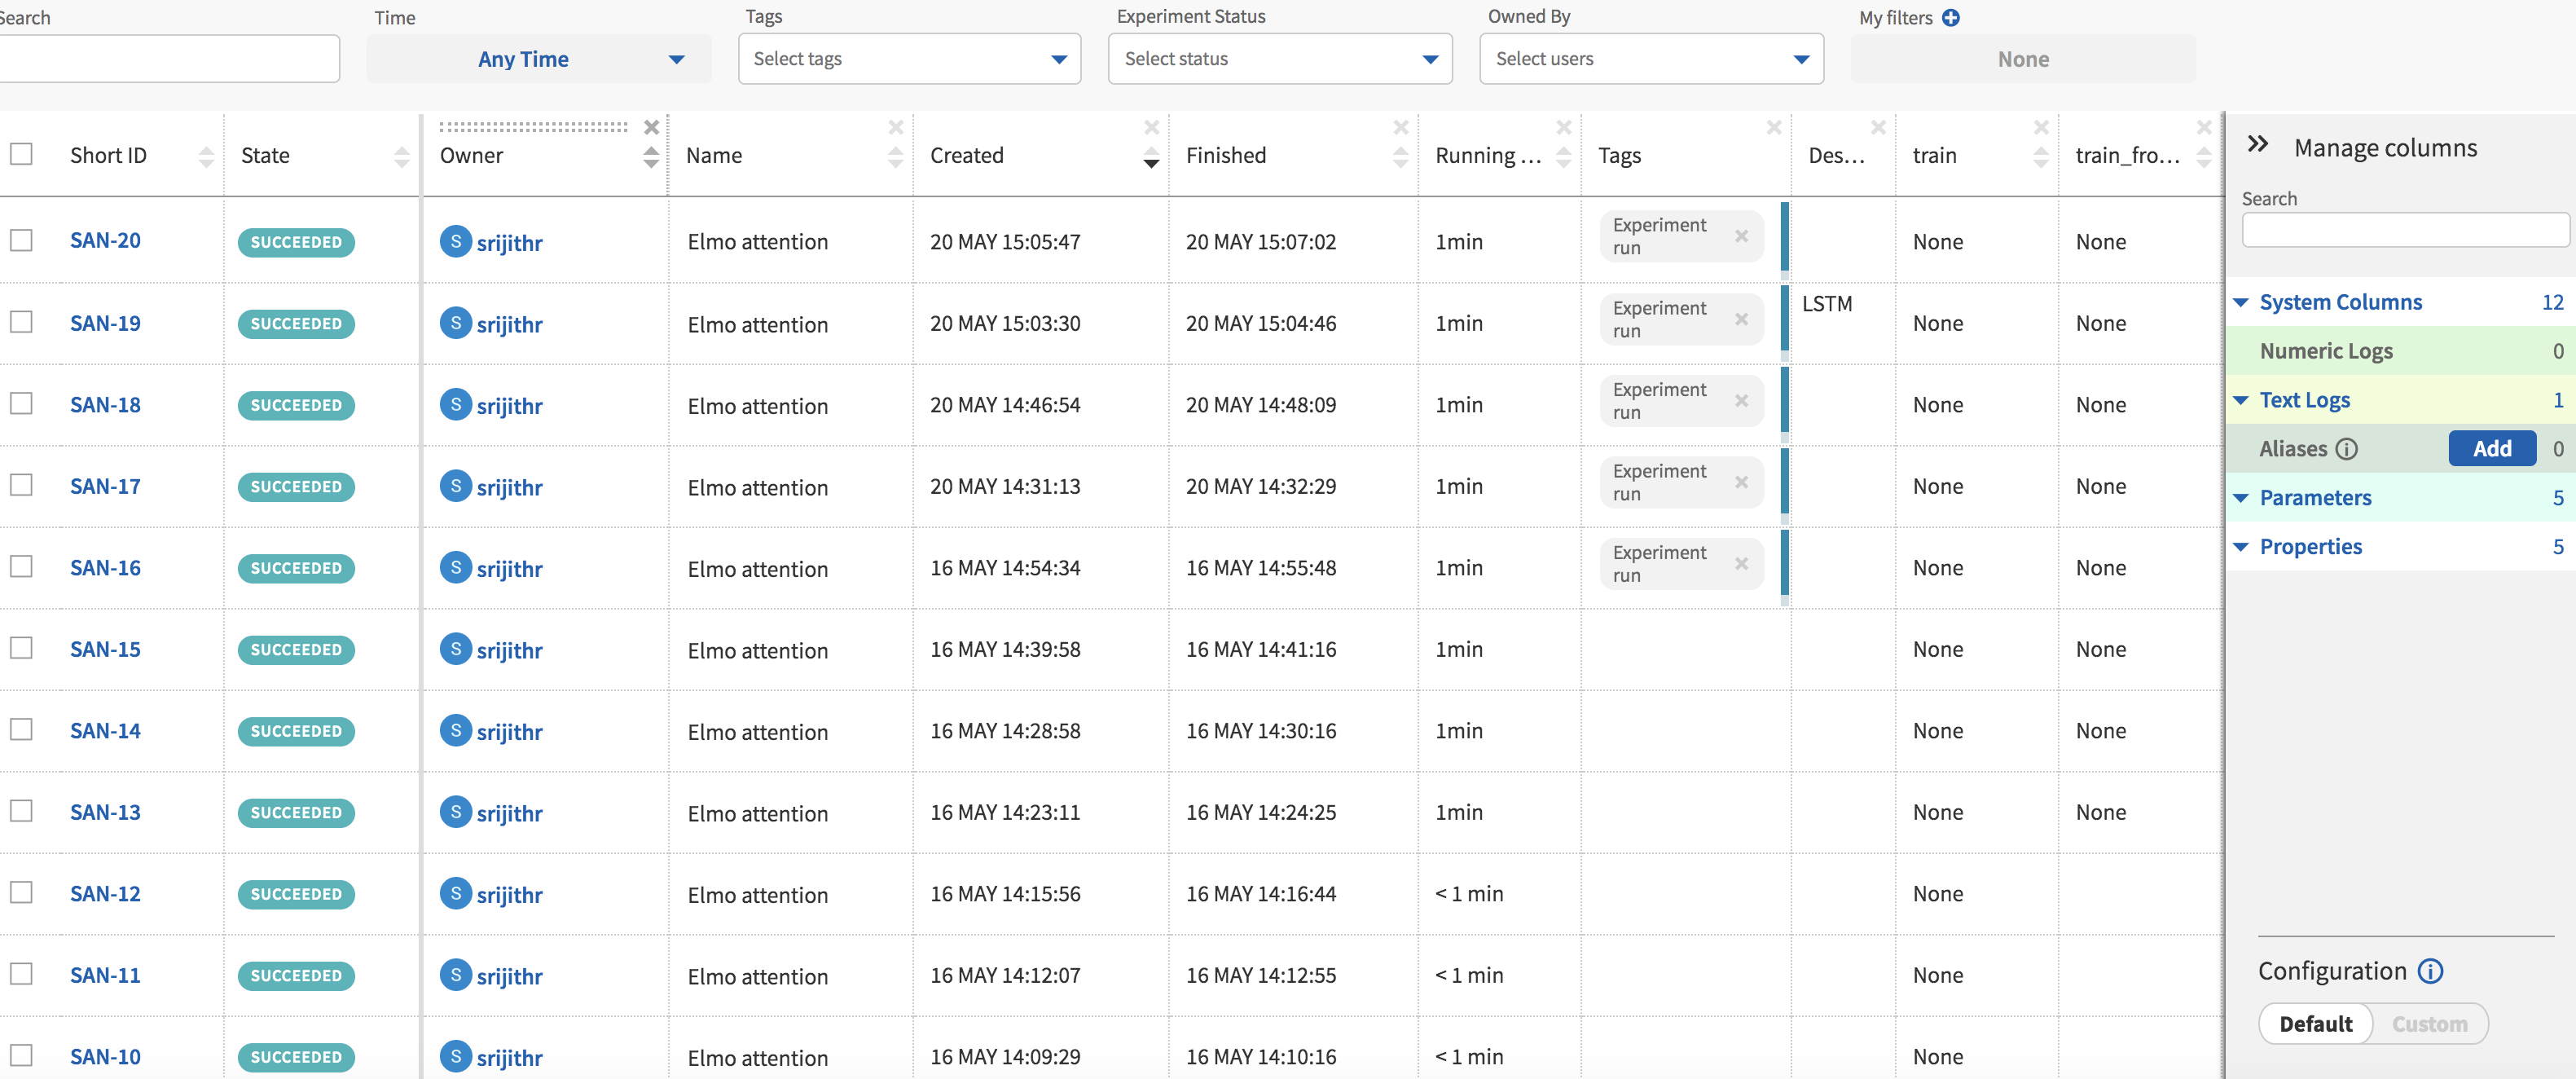
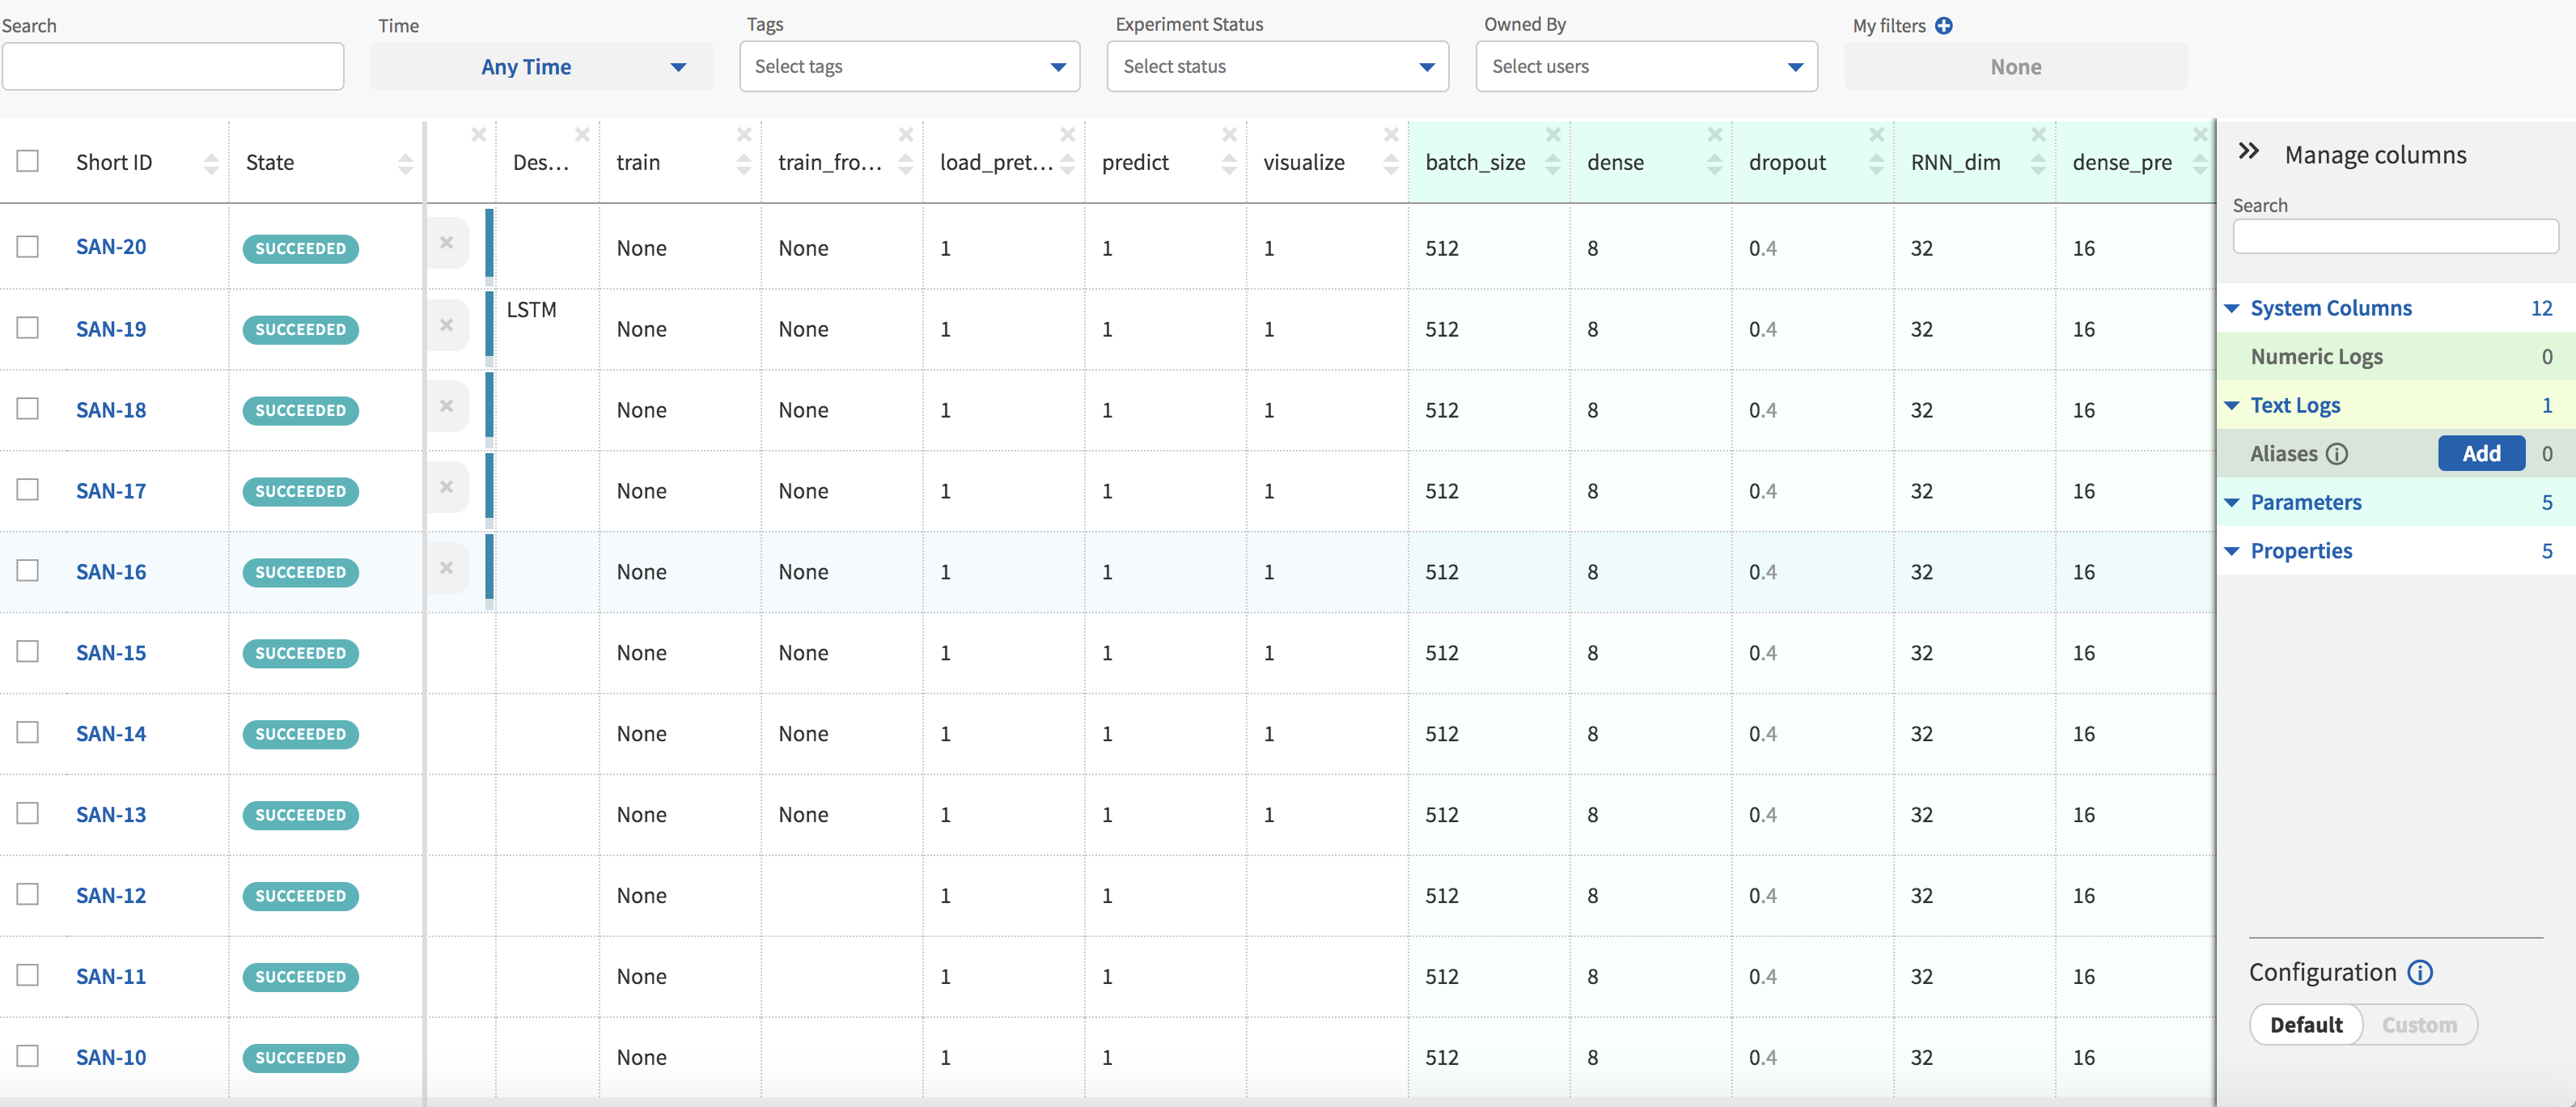
I have added further columns that display hyperparameters and flags specific to my code. The ability to group experiments by the values in these columns is a feature I have found to be useful when I am looking to compare model performance.
I import Neptune in a ‘try/except’ statement to make it environment agnostic since I run the same code on multiple machines.
try:
    import neptune
except ImportError:
    print("Neptune logging package not found, no metrics will be sent")
Initialize Neptune by calling the ‘init’ method with your API_TOKEN and a project name. Note that it is NOT a good practice to store your API token in your code, ideally this should be set in an environment variable ‘NEPTUNE_API_TOKEN’. Now create an experiment with the ‘create_experiment’ method by pass a model name , model description and the hyperparameters associated with the model. The hyperparameters can be passed as a dictionary of key/value pairs. If it is a logged experiment, I pass the ‘run_type’ flag set to 1 as a command-line argument. Otherwise, if I am debugging the code this is set to 0 and no metrics are logged in Neptune. Shown below is how I log the other command-line arguments that indicate what I want my model to do. I use the ‘set_property’ method within Neptune to do so. As far as I can tell, this has to be passed as a string even if you have numeric values for your properties.
if(run_type == 1):

      # --- Initialize Neptune with your token --- #
      neptune.init(api_token=API_TOKEN, project_qualified_name='VT-ARC/sandbox')

      # --- Create experiment in the project defined above --- #
      neptune.create_experiment(name='Elmo attention', description=description, params={'batch_size': BATCH_SIZE,'dropout': DROPOUT, 'RNN_dim': RNN_DIM, 'dense_pre': DENSE_PRE, 'dense' : DENSE})

      # --- Have Neptune log my input arguments --- #
      neptune.append_tag('Experiment run')
      neptune.set_property('train',str(train_flag))
      neptune.set_property('train_from_checkpoint',str(train_from_checkpoint_flag))
      neptune.set_property('load_pretrained',str(load_pretrained_flag))
      neptune.set_property('predict',str(predict_flag))
      neptune.set_property('visualize',str(visualize_flag))
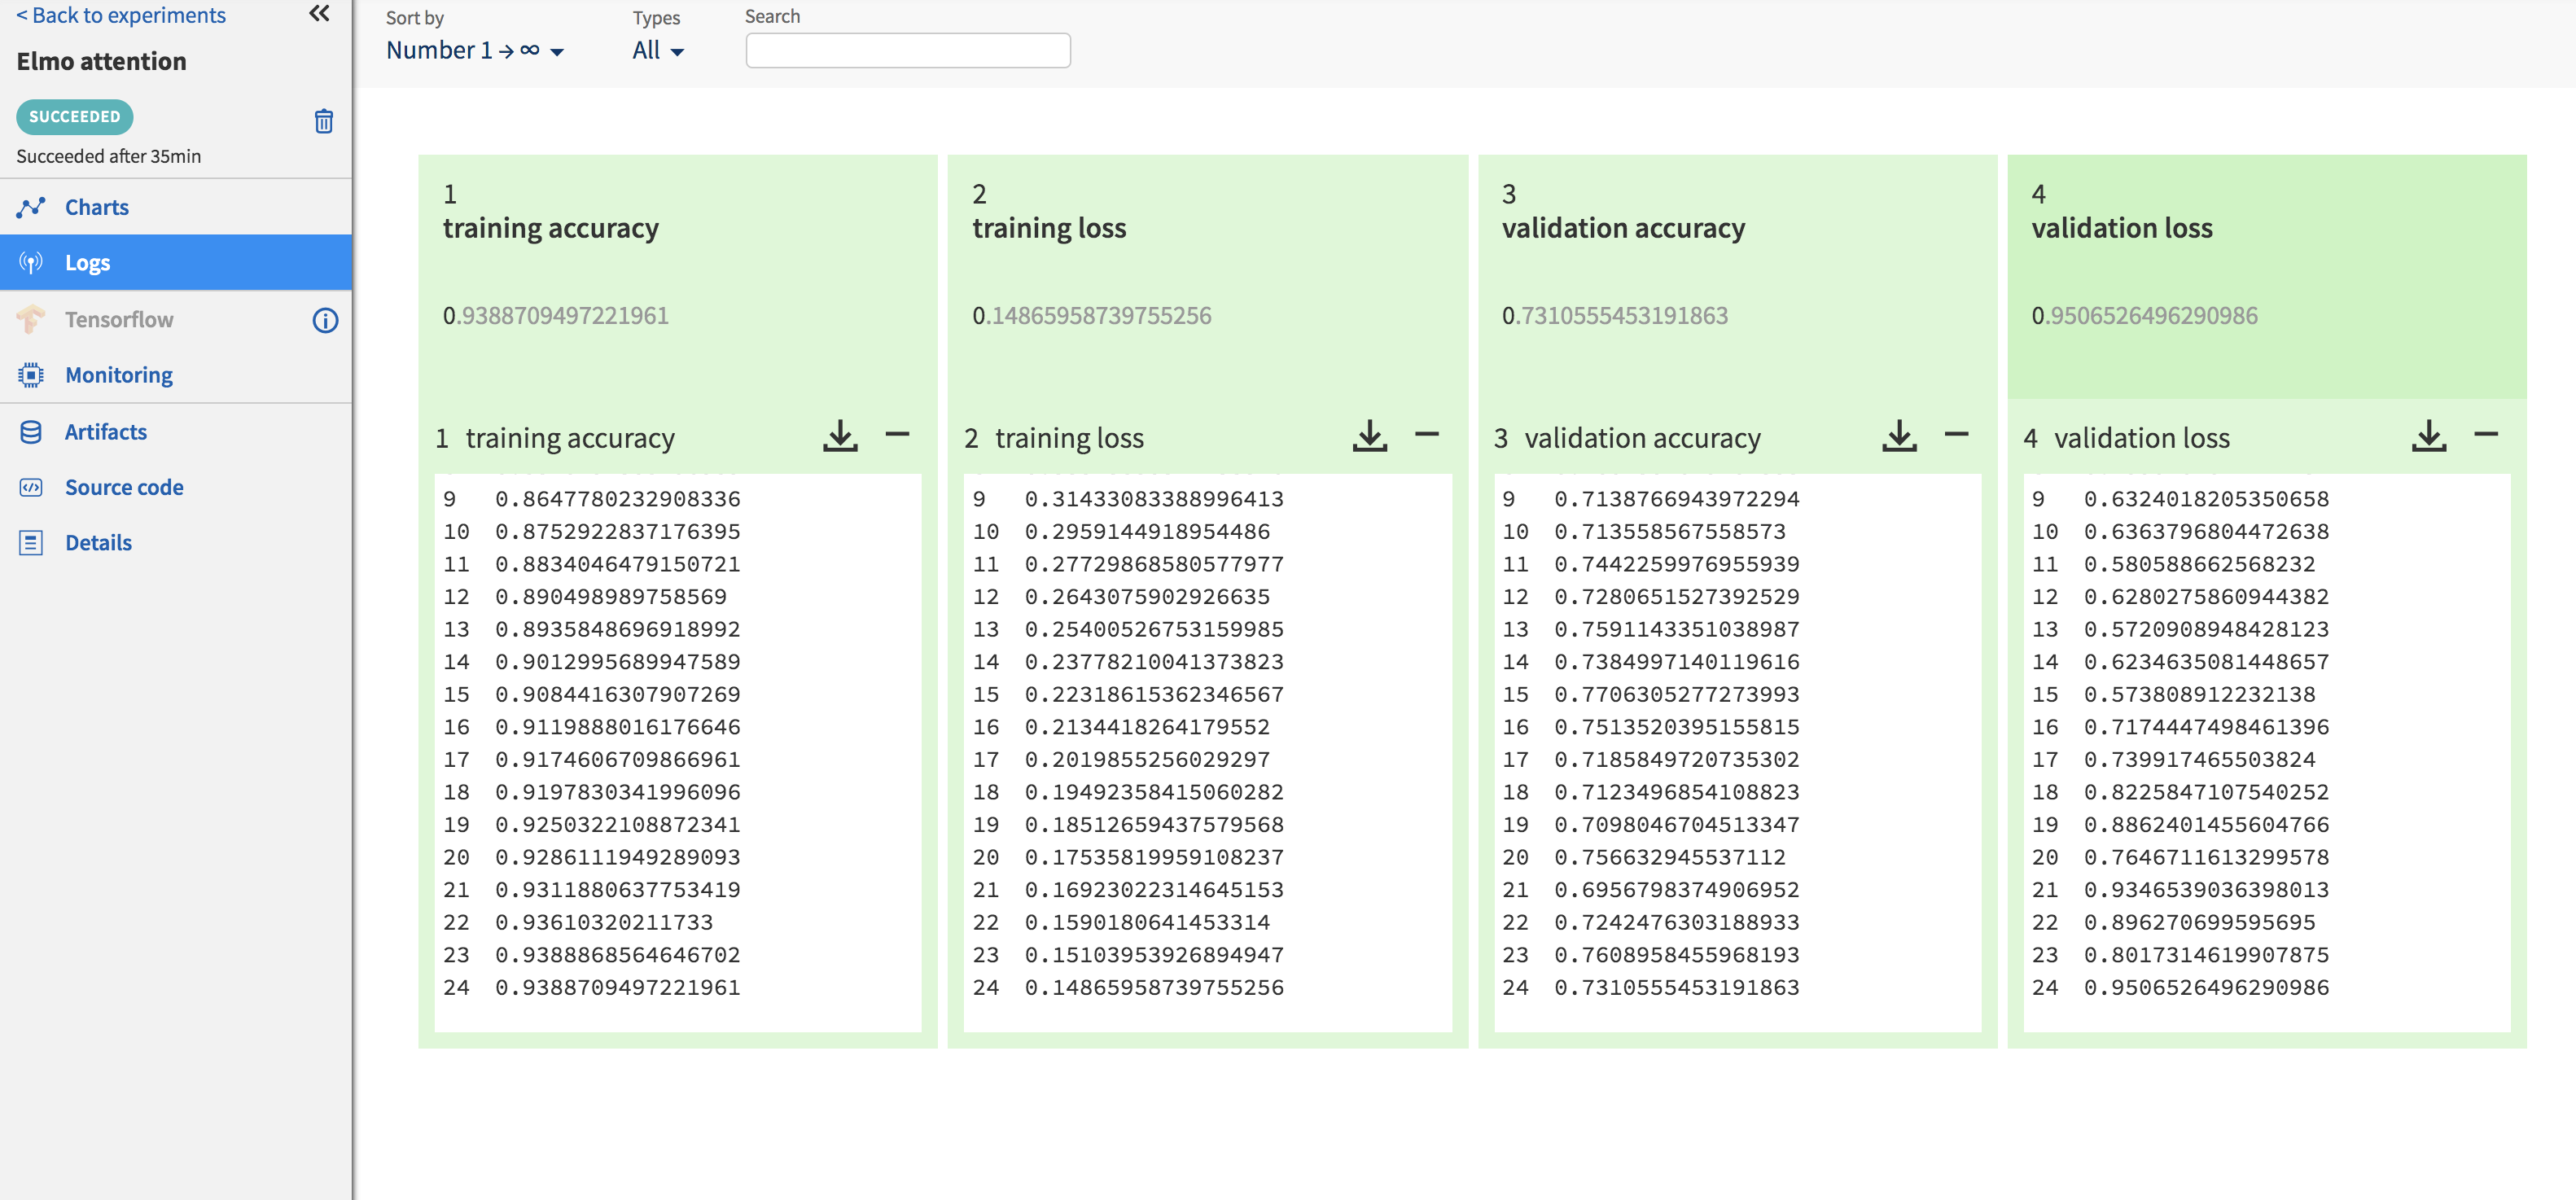
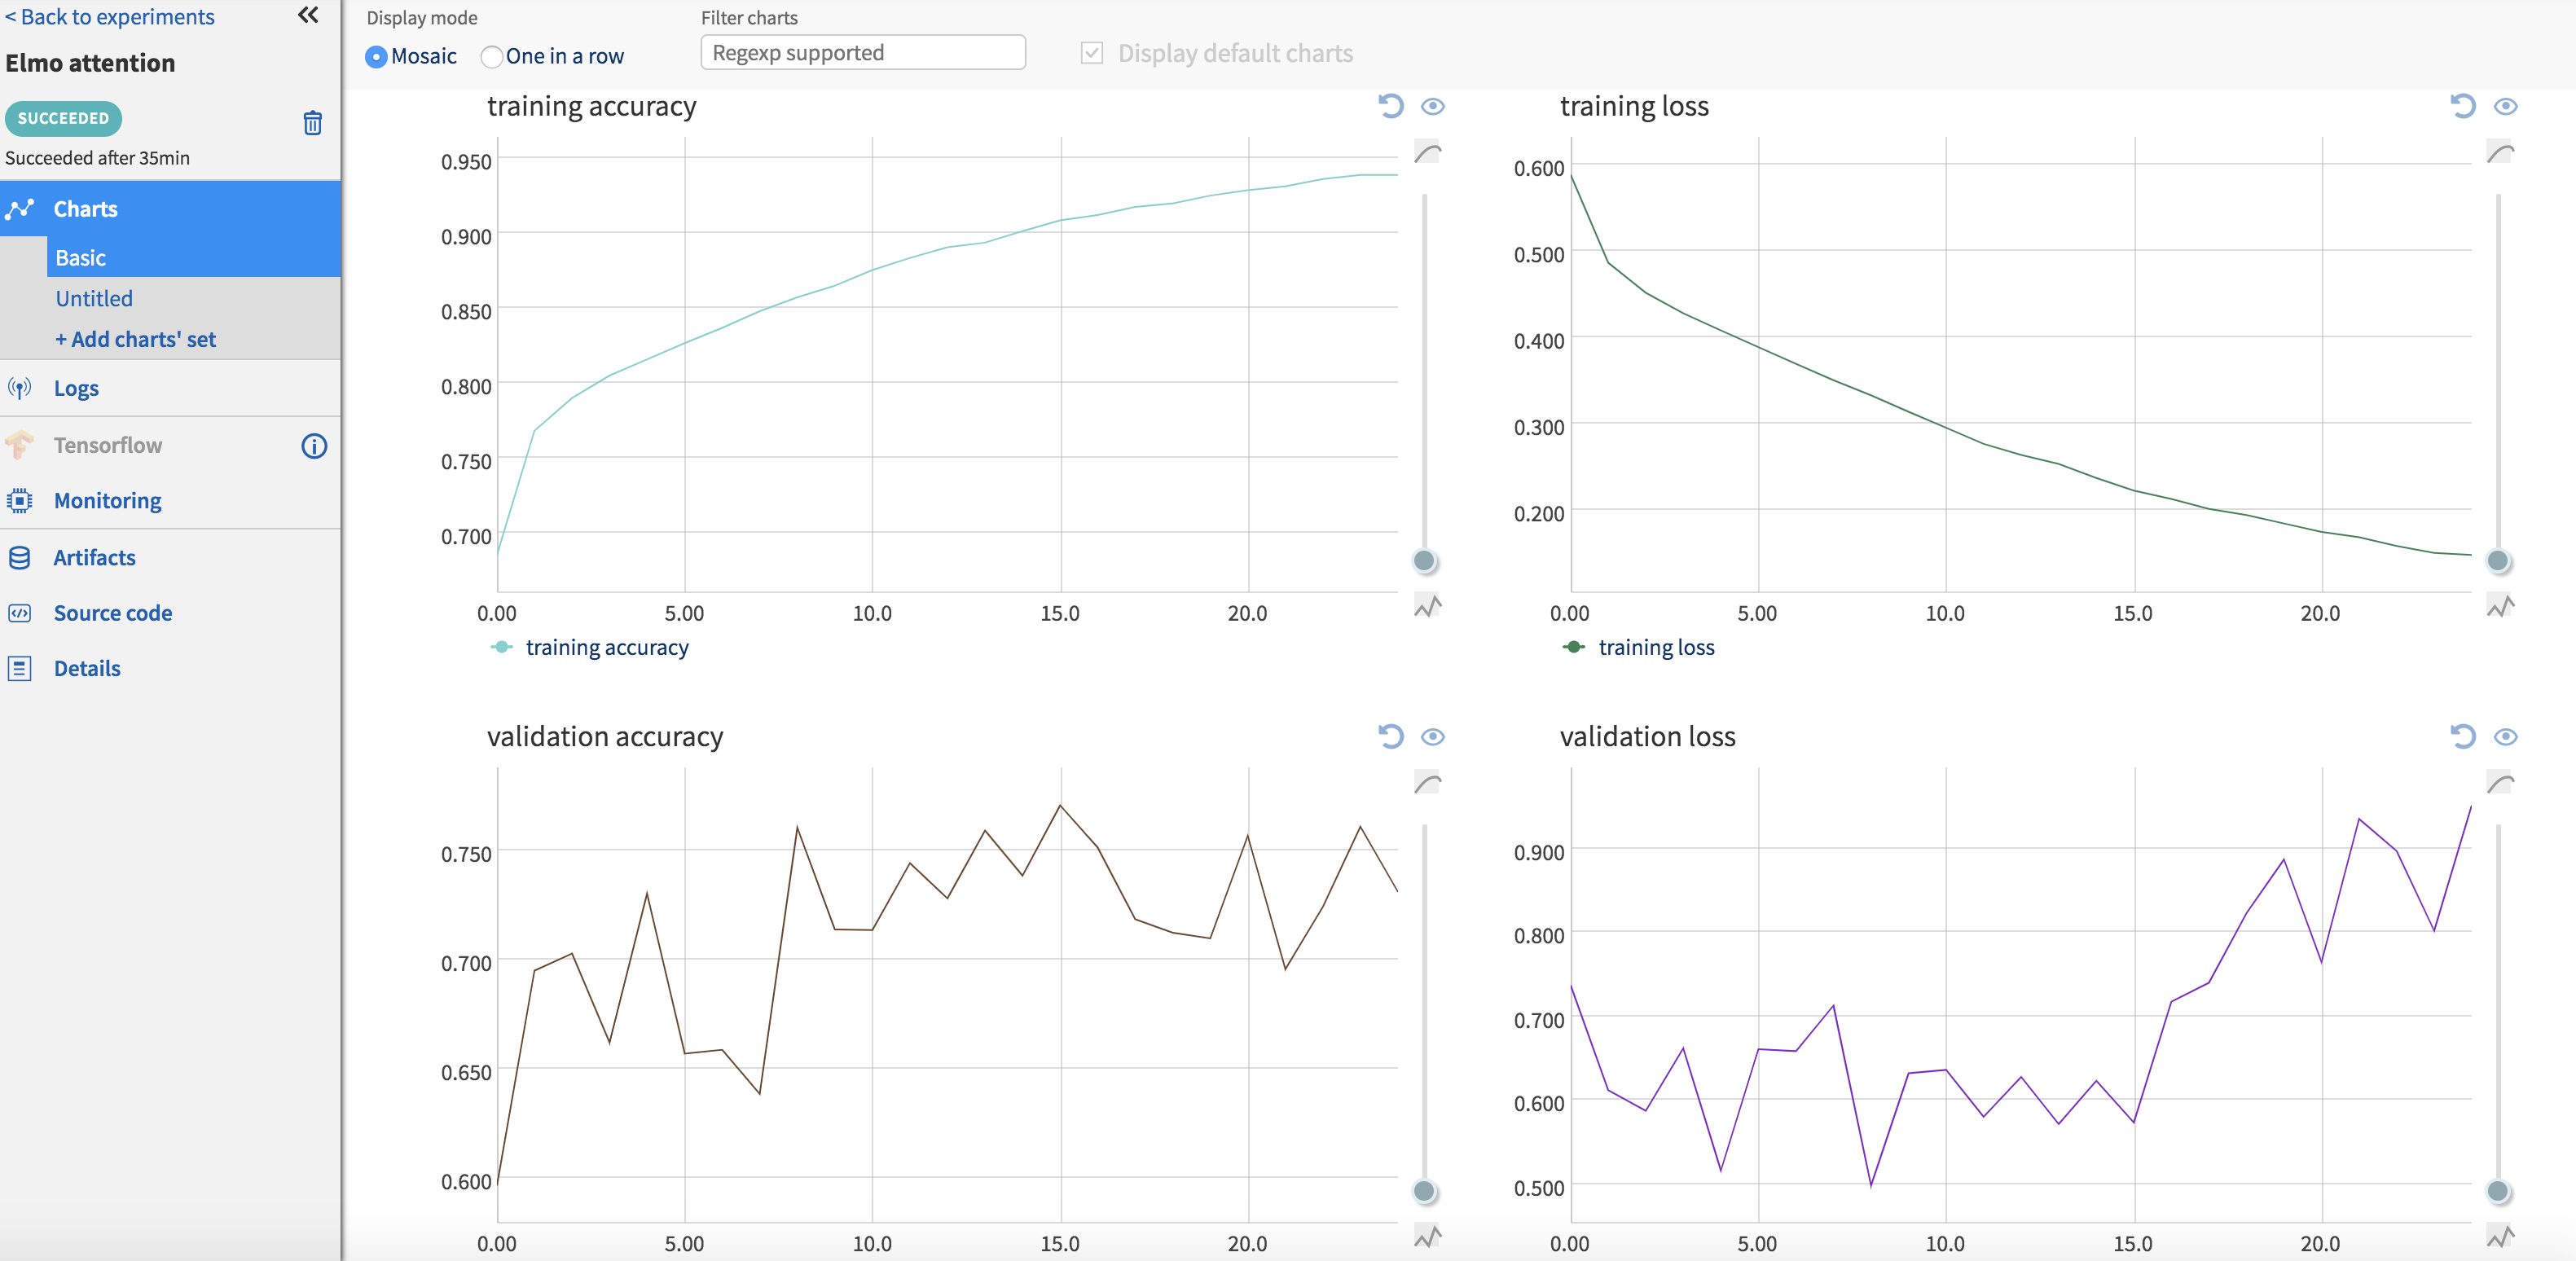
Logging training and validation metrics such as loss and accuracy per epoch can be done by setting up a callback method that pushes these metrics to Neptune using ‘send_metric’. The callback method is then passed to ‘model.fit()’. The code snippet to do this is shown below. Clicking on each experiment in the ‘Experiments’ page opens up a new page with information about this particular experiment. These metrics are available to view under the ‘Logs’ section (Fig.) of this page. Graphs are also auto-generated for these metrics, which can be seen by clicking on the section appropriately titled ‘Charts’ (Fig. ).
class NeptuneMonitor(Callback):
    def on_epoch_end(self, epoch, logs={}):
        acc = logs['acc']
        loss = logs['loss']
        val_acc = logs['val_acc']
        val_loss = logs['val_loss']
        neptune.send_metric('training accuracy', epoch, acc)
        neptune.send_metric('training loss', epoch, loss)
        neptune.send_metric('validation accuracy', epoch, val_acc)
        neptune.send_metric('validation loss', epoch, val_loss)

neptune_monitor = NeptuneMonitor()

model.fit(train_text,
          train_label,
          shuffle=True,
          validation_split=0.2,
          epochs=N_EPOCHS,
          batch_size=BATCH_SIZE,
          callbacks=[csv_logger, checkpointer, neptune_monitor])
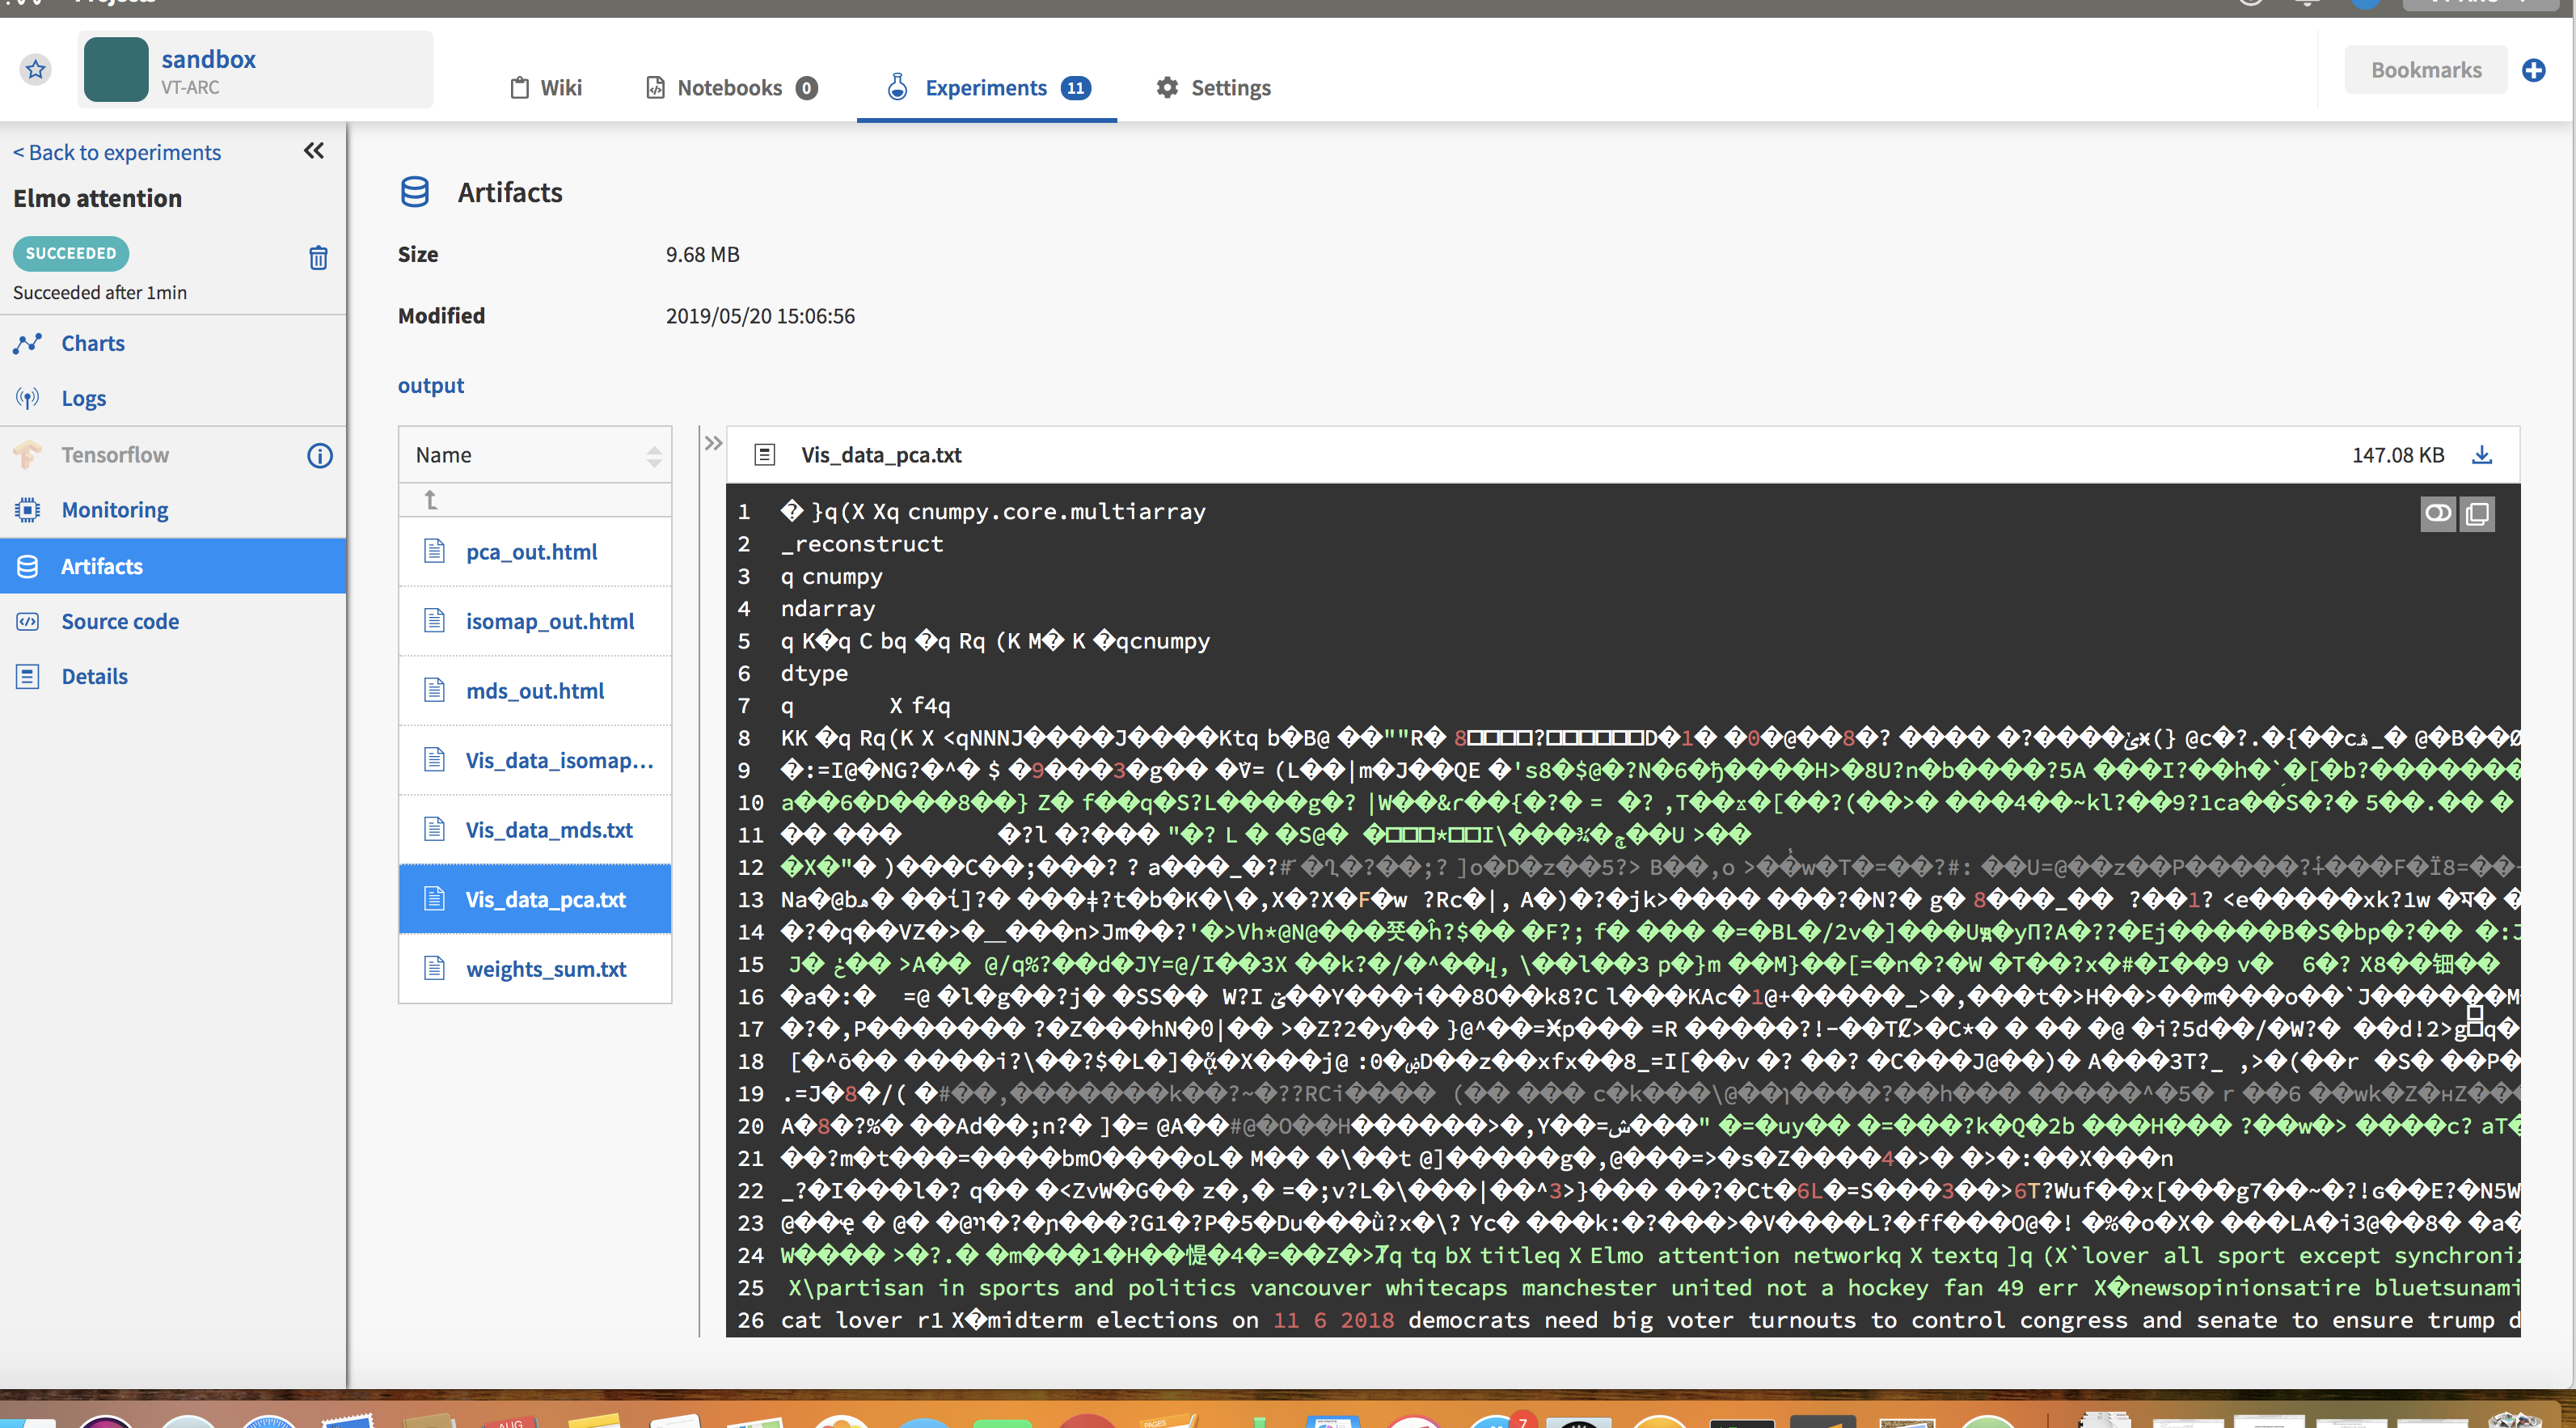
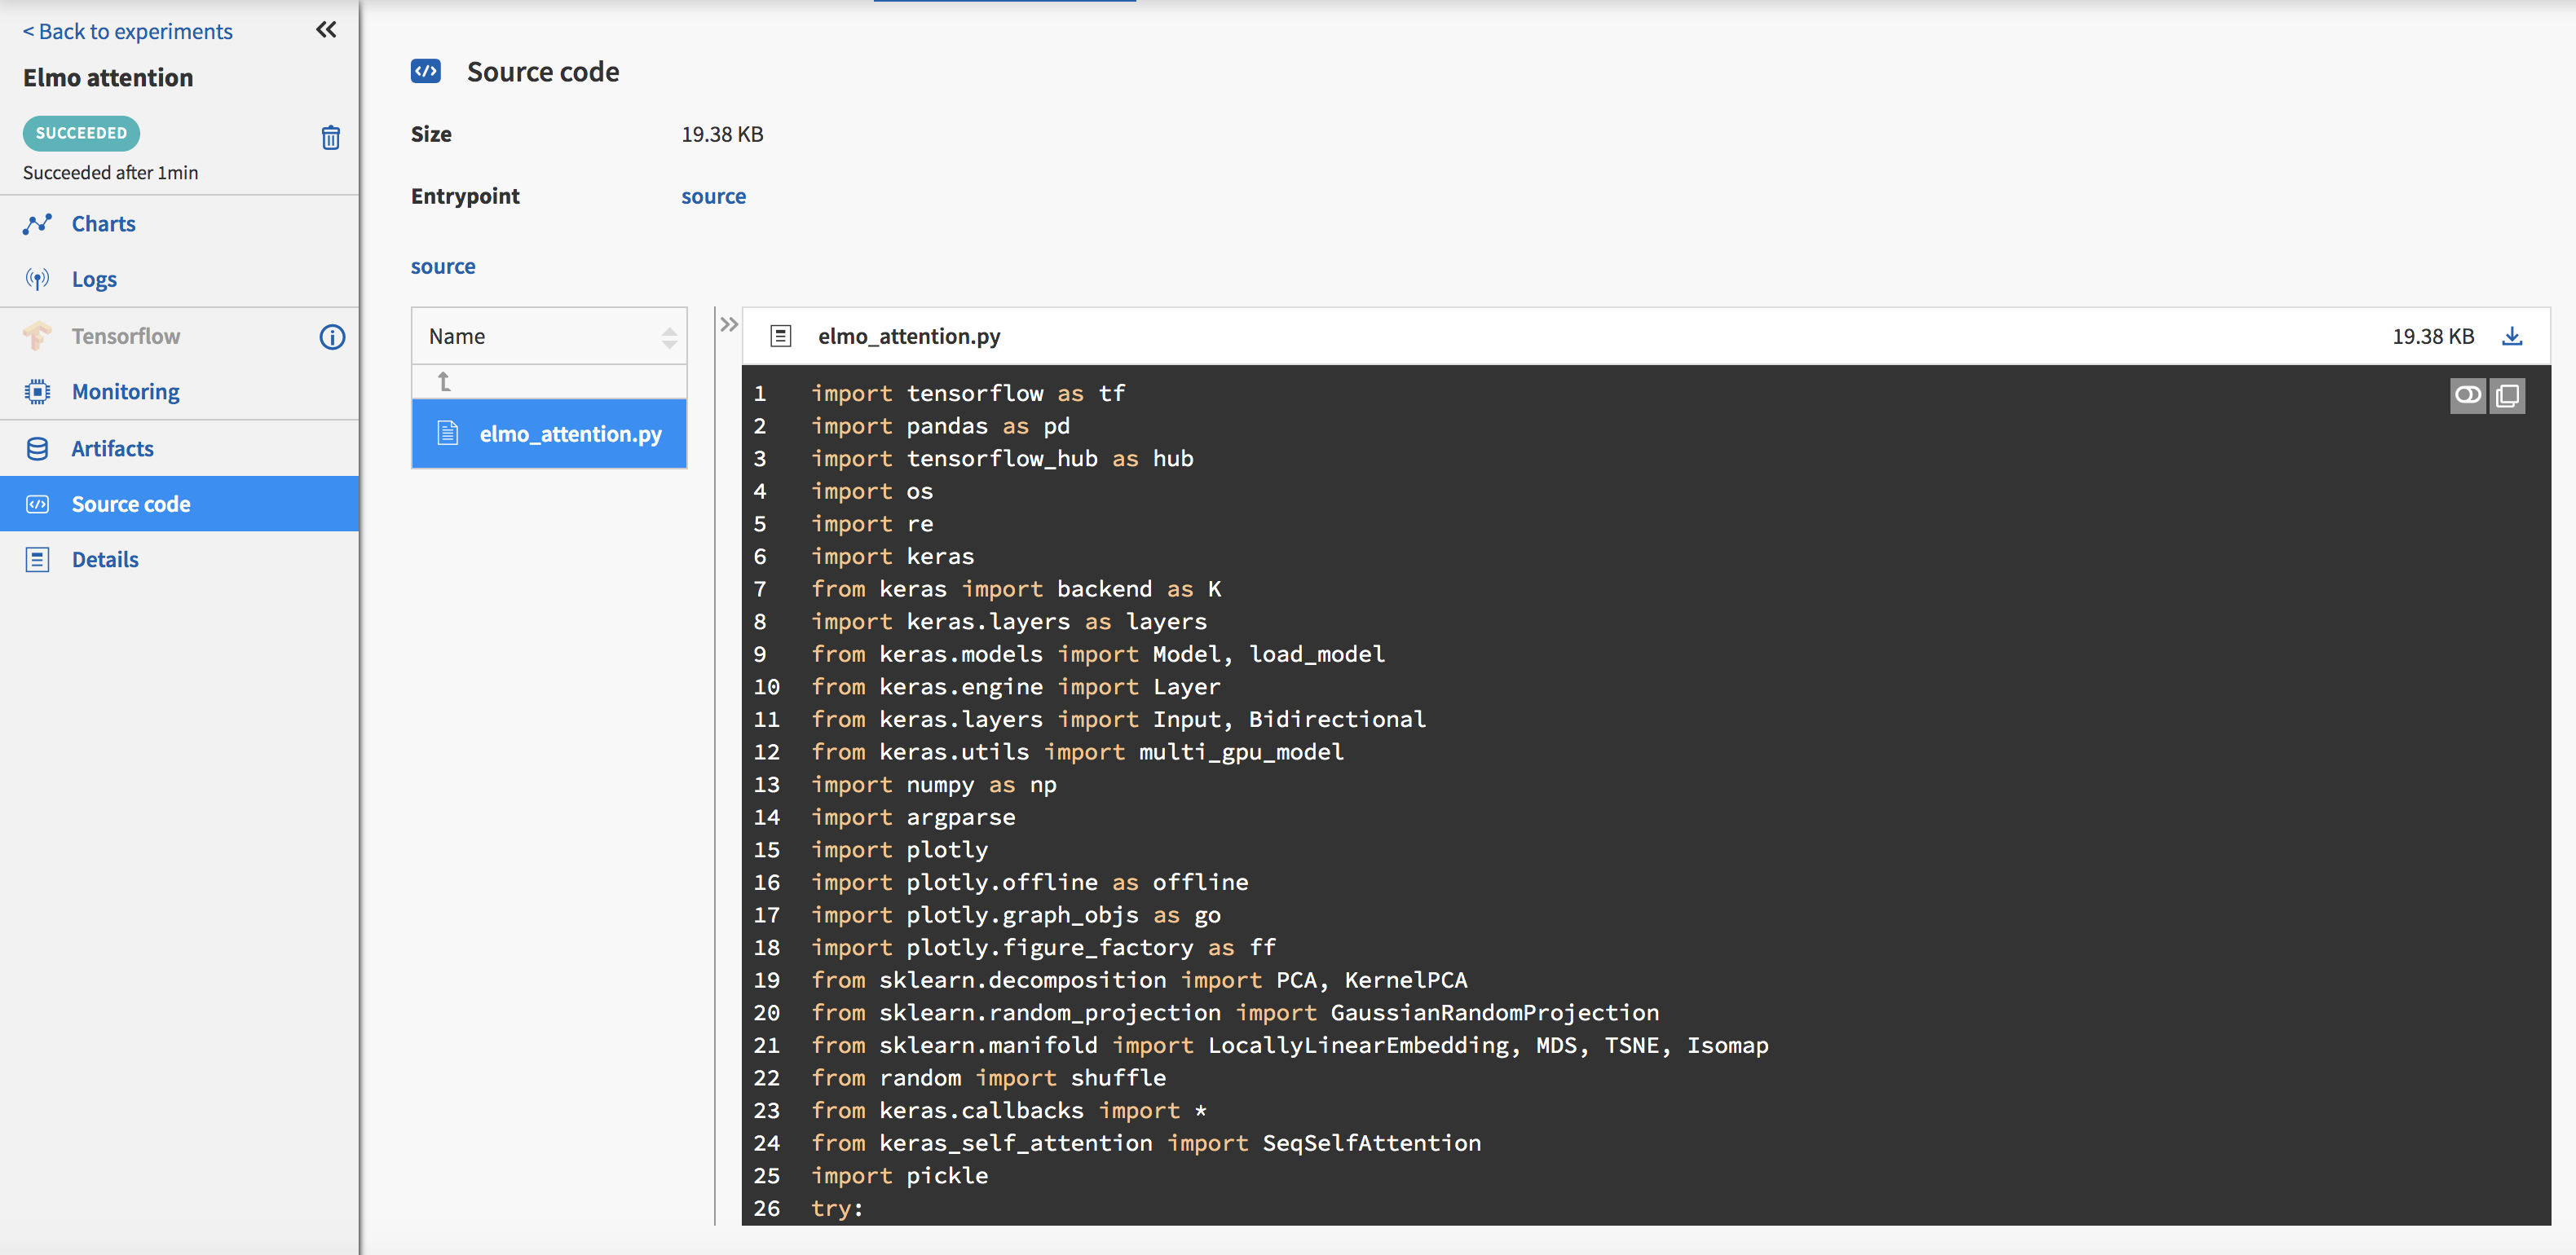
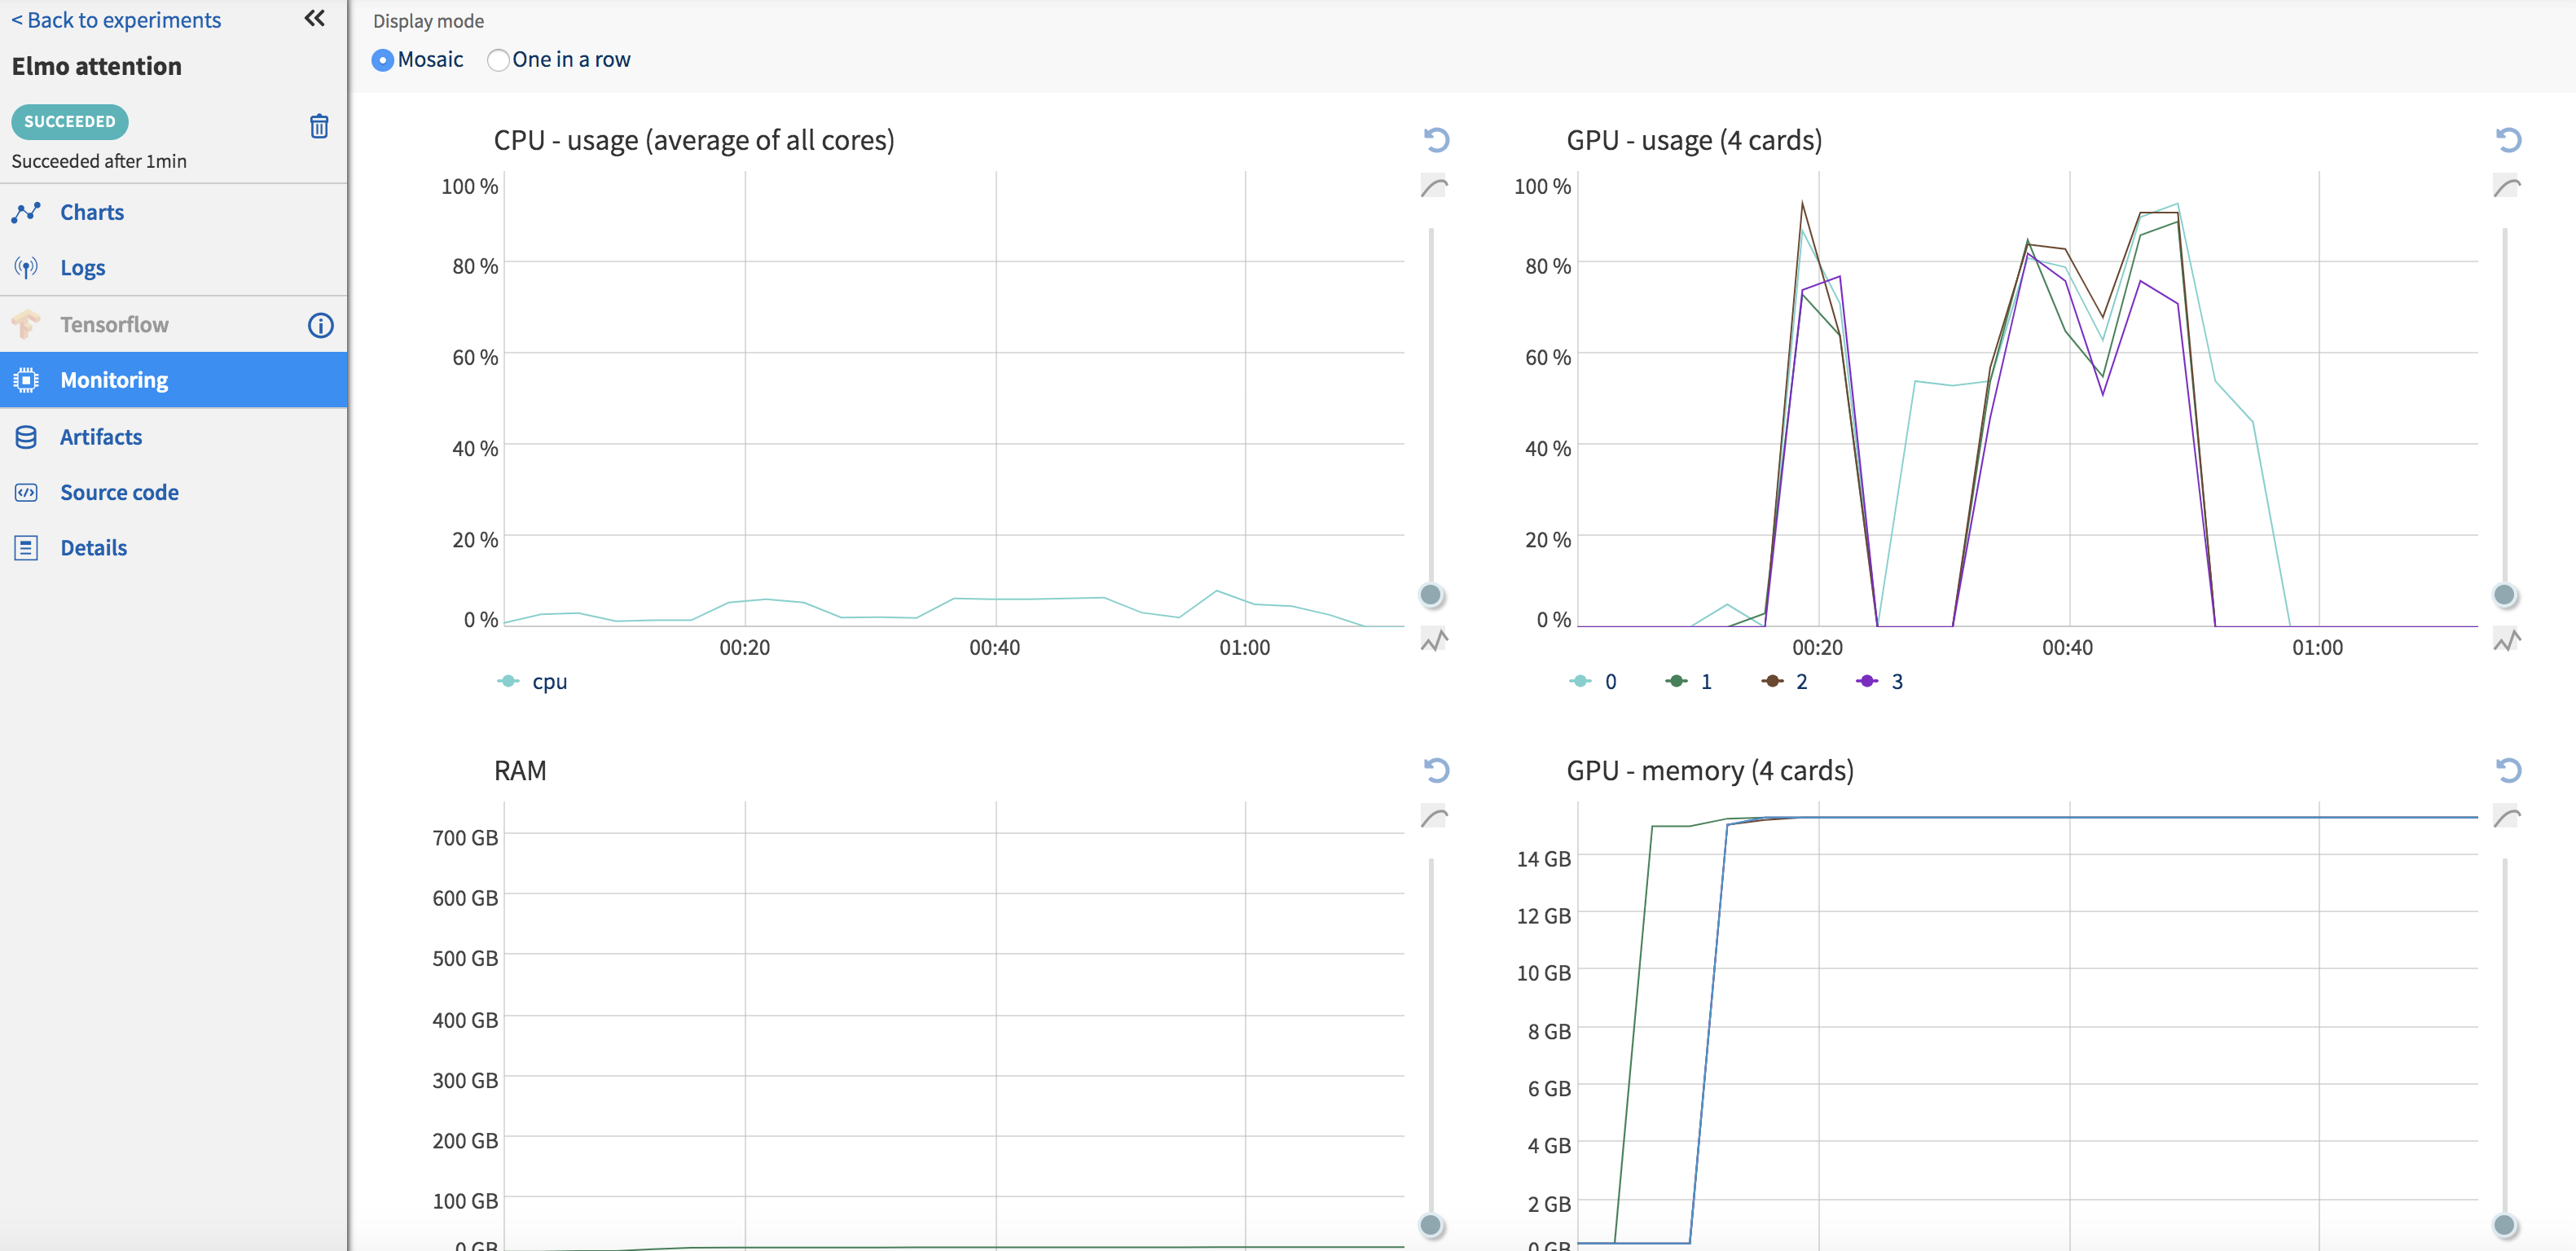
Once your code has finished running, output files can be pushed to the Neptune server using the ‘send_artifact’ method. Output files can be a results file (text or binary), images or the model itself. I write out numpy arrays (Fig.) and visualizations in a .html file since I need them to be interactive. Although Neptune can display most image formats in their UI, this does not work for .html files and I have to download them before I can view them. I would assume that this is not a problem for most use-cases. It also stores the code associated with each run (Fig. ), so reproducibility is no longer a concern. Neptune also collects some system usage information (Fig. ) for each run such as GPU/CPU usage, RAM utilization etc.
if(run_type == 1):
      neptune.send_artifact('weights_sum.txt')
      if(visualize_flag):
          neptune.send_artifact('Vis_data_pca.txt')
          neptune.send_artifact('Vis_data_mds.txt')
          neptune.send_artifact('Vis_data_isomap.txt')
          neptune.send_artifact('mds_out.html')
          neptune.send_artifact('isomap_out.html')
          neptune.send_artifact('pca_out.html')
      neptune.stop()
What I have not covered
Neptune is a powerful and evolving framework. I have not covered features such as Jupyter notebooks, datafile hashing or multi-user collaboration. I hope to edit this post as I do further testing with Neptune.